NetLock RMM Documentation
Welcome to the NetLock RMM user manual. This site covers everything an IT administrator or MSP technician needs to install, configure, and operate a fleet of devices with NetLock RMM, from the first login through advanced automation and reporting.
The manual is organised into five parts. Start with Part I if you are new to the product; jump directly to Part II or Part III if you already know the core concepts and want a specific feature or task.
Part I — Getting Started & Concepts
Orientation material. Read this part before touching the Console if you are new to NetLock RMM.
- 1.1 What is NetLock RMM? — product overview, deployment modes, and who the product is for.
- 1.2 Core Concepts — tenants, locations, groups, agents, policies, Collections, and permissions.
- 1.3 First-Run Walkthrough — from first login to the first device under management in under an hour.
- 1.4 Navigating the Console — layout, navigation menu, tenant selector, dark mode, and help.
Part II — Console Reference
One chapter per top-level menu group. Use this part when you need to know what a specific page or dialog does.
- Chapter 2 — Dashboard
- Chapter 3 — Devices
- Chapter 4 — Tenants, Locations & Groups
- Chapter 5 — Automations
- Chapter 6 — Policies
- Chapter 7 — Patch Management
- Chapter 8 — Collections
- Chapter 9 — File Server & Monitoring
- Chapter 10 — Tickets
- Chapter 11 — Reports
- Chapter 12 — Events & Audit
- Chapter 13 — AI Chat
- Chapter 14 — Users & Roles
- Chapter 15 — Community
Part III — How-To Guides
Task-oriented recipes. Each guide is short, prescriptive, and links back into Part II for concept reference.
The guides cover deploying the first agent, building and applying a policy, configuring Windows Defender, setting up patching, writing a PowerShell script, deploying software with App Hub, restricting USB devices, configuring notifications, enabling SSO, branding the Console, running compliance reports, remote-controlling a device via relay, upgrading NetLock RMM, replacing the Members Portal API key, reloading licence information after a renewal, installing the server with Docker, and monitoring a device with SNMP.
Part IV — Administration
Deeper reference material for system operators. Covers licensing, updates, database management, security (SSO, IP whitelist), globalization, whitelabeling, remote screen control, notification channels, logging, system settings, AI / LLM configuration, and content defaults.
Start with A.1 System overview & licensing.
Part V — Appendix
Reference tables and quick lookups.
- X.1 Glossary
- X.2 Permission reference
- X.3 Troubleshooting
- X.4 Keyboard shortcuts
- X.5 Integration endpoints
- X.6 Changelog pointer
- X.7 Feature matrix
- X.8 Platform support
Conventions used in this manual
-
UI labels, routes, and permission flags appear in backticks:
Settings → SSO,collections_application_control_manage. -
Navigation paths use
→to separate menu levels. -
Callouts flag important information:
Note: Informational aside worth reading. Tip: Shortcut or recommendation. Warning: Action you probably do not want to take by accident. Optional module: Content only applies when a particular module is enabled.
-
Keyboard shortcuts use
<kbd>tags, for example Ctrl + K.
What is NetLock RMM?
NetLock RMM is a remote monitoring and management (RMM) platform for IT administrators and managed service providers (MSPs). You use it to deploy an agent to the devices you manage, see their status in real time, apply policies, schedule automations, push patches, run scripts, distribute software, hand out remote-control sessions, and keep an auditable record of everything that happens along the way.
The product is delivered as a web Console backed by a server and an agent you install on each managed device. All three components are covered in this manual; the Console is the main surface you interact with.

Who the product is for
NetLock RMM targets two audiences:
- IT admins inside a single organisation. You manage a single fleet of workstations, laptops, and servers. You typically use one tenant, a small number of locations, and a handful of user accounts for your colleagues.
- MSP technicians managing multiple customer organisations. You create one tenant per customer, organise their devices into locations and groups, apply policies that differ per customer, and scope user permissions so that technicians see only the tenants they are assigned to.
Both audiences use the same Console. The difference is scale — whether you work with one tenant or a hundred — not the feature set.
Deployment modes
NetLock RMM runs in two deployment modes. Functionally they are the same; operationally they differ in who manages the server.
| Mode | Who runs the server | What you see in the Console |
|---|---|---|
| Cloud | Hosted by the NetLock RMM vendor | All settings pages are available, the same as on a self-hosted deployment. The vendor manages updates, backups, and infrastructure for you. |
| Self-hosted | You run the server on your own infrastructure | All settings pages are available. You are responsible for updates, database backups, and maintenance. |
Throughout this manual, sections that apply to only one mode are flagged with a callout:
Cloud only: This section applies only to the hosted deployment.
Self-hosted only: This section applies only to self-hosted deployments.
If neither callout appears, the content applies to both modes.
What NetLock RMM does at a glance
The Console is organised into roughly a dozen top-level feature areas. At the highest level:
- Monitoring. A real-time Dashboard of customisable panels, a device inventory with online/offline status, custom sensors you define, and a website uptime monitor.
- Configuration. Policies that define how devices should be configured (Windows Defender, firewall rules, and more), applied per device or group.
- Automation. Automations that trigger on events or schedules and compose scripts, jobs, and policy actions.
- Patch & software management. Patch Management for operating system patches, plus App Hub and Software Deployment for applications.
- Remote access. Remote shell, remote desktop, and relay sessions that traverse firewalls.
- Governance. Events for operational activity, an immutable Audit trail for admin actions, Reports for compliance, and a role-based permissions model for users.
- Optional modules. Tickets for helpdesk workflows and Community for shared intelligence; each can be disabled per deployment.
The rest of this manual describes each of these areas in detail.
What NetLock RMM is not
Setting expectations up front saves time later:
- It is not a replacement for a dedicated SIEM. The Audit trail is auditable, but large-scale security event aggregation belongs in a SIEM you forward events into.
- It is not an identity provider. You can sign in with SSO (OIDC / SAML), but NetLock RMM consumes identities; it does not issue them.
- It is not a backup product. File Server distributes files to agents; it does not perform image-level backups of managed devices.
How to use this manual
The quickest path for a new deployment is:
- Read Core Concepts so the vocabulary in the rest of the manual makes sense.
- Work through the First-Run Walkthrough to get one device under management.
- Skim Navigating the Console so you know where things live.
- Jump into Part II for the feature area you need next, or Part III if you want a task-by-task recipe.
For day-to-day reference, use Part II (one chapter per menu group) or Part V (glossary and lookup tables).
Core Concepts
NetLock RMM is easier to learn if you read the vocabulary first. The product uses a small number of terms very consistently, and almost every chapter in Part II assumes you already understand the ones introduced here. Read this chapter end-to-end before jumping into feature documentation.
The agent, the server, and the Console
Three components form the system:
- The agent is a small piece of software installed on every device you want to manage. It reports status, runs jobs you schedule, enforces policies, and provides the endpoint for remote shells and file transfers. Once installed it talks to the server on a regular schedule.
- The server is the central component. It holds configuration, receives data from agents, runs the web Console, and mediates remote-access sessions. In cloud deployments the vendor runs it; in self-hosted deployments you run it.
- The Console is the browser-based user interface you spend your day in. It reads and writes configuration to the server; it does not talk to agents directly.
Every feature in this manual ultimately reduces to "the Console tells the server what should happen, and the agent makes it so".
Tenant, location, group
NetLock RMM organises managed devices into a three-level hierarchy. Every device belongs to exactly one group, which belongs to exactly one location, which belongs to exactly one tenant.
- A tenant is the top-level container. For an in-house IT team this usually maps to "the company". For an MSP it maps to one customer organisation.
- A location is a subdivision of a tenant, usually a physical site or office. A small tenant might have one location; a multi-site customer will have several.
- A group is a subdivision of a location. Groups typically reflect how devices should be configured rather than where they physically are — for example
Servers,Workstations,Kiosks.
The hierarchy is primarily an organisational structure for devices and for scoping what users can see. Unlike some RMMs, you do not attach policies directly to a tenant, location, or group. Instead, policies are routed to devices by Automations, which match devices by attributes such as their tenant, location, or group name.
See Chapter 4 for the full reference on managing this hierarchy.
Tip: Group devices by how they should be configured, not just where they live. "Every laptop, regardless of site" is a better group than "every device in the Berlin office" if your policies differ primarily by device type.
Agents and devices
A device is a managed computer — a workstation, laptop, or server. When you install the agent on a new device, it contacts the server and registers itself as an unauthorized device: present on the network, but not yet accepted into a tenant. An administrator reviews unauthorized devices in Devices → Unauthorized, chooses the tenant, location, and group to assign them to, and approves them. From that moment the device is an authorized device and appears in the main device list.
Note: Agents that have never been approved are the most common source of "missing device" support tickets. The First-Run Walkthrough covers the approval flow in detail.
Devices also carry a label (a free-form human-readable name), custom fields defined at the Collections level, and any number of per-device settings. Chapter 3 is the canonical reference for everything device-related.
Policies
A policy is a named bundle of desired configuration for a device. Examples: "managed laptops — strict", "kiosk devices", "server baseline". A single policy can configure:
- General agent behaviour (sync interval, auto-update).
- Tray Icon branding and visibility.
- Windows Defender Antivirus — exclusions, scan jobs, notifications.
- Windows Application Control and USB Device Control rulesets.
- Linux UFW firewall.
- SNMP sensors to collect on devices.
- Scheduled Jobs to run on devices.
- Patch Management rollout rules, per platform (Windows, Linux, macOS, Docker).
- Which App Hub apps are exposed in the Tray Icon.
Policies are edited in the Policy Settings page and stored in the server database. The agent picks up changes on its next sync (5-1440 min, configurable per policy).
Important: NetLock RMM does not keep a policy version history and does not support rolling back to a previous policy state. Edits apply in place. If you need a safety net, clone a policy before making a risky change.
A device is assigned at most one policy at a time. Policies are not layered or merged.
Automations
An automation in NetLock RMM is narrower than the word implies in other products. It is a rule that decides which policy gets assigned to which device, based on a simple condition:
IF a device's <attribute> matches <expected value> THEN assign policy <name><attribute> is one of: Device Name, Tenant, Location, Group, Internal IP-Address, External IP-Address, Domain.
There are no event triggers, no schedule triggers, no manual triggers, and no actions other than assigning a policy. Automations do not run scripts, send notifications, create tickets, or chain steps. Their only job is to route policies to devices.
When a device syncs, the server evaluates all automations in priority order. The first rule whose condition matches the device determines the device's policy. If no rule matches, the device has no policy. Adding, editing, or deleting an automation forces every connected device to re-evaluate immediately.
The practical consequence: to give devices a policy, you need both a Policy and at least one Automation whose condition matches those devices. A policy on its own is inert.
For event-driven work — "run a script when a disk fills up", "open a ticket when a sensor breaches a threshold" — NetLock RMM uses Sensors (with action scripts) and Jobs (scheduled scripts), not Automations. See Chapter 8 — Collections.
Collections
Collections is the umbrella term for reusable building blocks you create once and reference from many places. Eight kinds of Collection item exist:
| Item | Purpose |
|---|---|
| Script | A PowerShell or Bash snippet you run on one or many devices. |
| Job | A scheduled background task that runs on the agent. |
| Sensor | A custom metric the agent reports back on an interval — CPU, memory, a specific application's health. |
| Custom Field | A per-device attribute (text, dropdown, date, checkbox) added to every device inventory. |
| App Hub entry | A packaged application from Winget (Windows) or Flathub (Linux), or a manual package, available for deployment. |
| Application Control ruleset | Rules that whitelist applications by hash or path. |
| Device Control entry | Rules that whitelist USB and peripheral devices. |
| Software Deployment | A packaged deployment of one or more App Hub entries or manual packages to a target set of devices. |
Collections items are cross-referenced: an automation may invoke a script, a policy may include an Application Control ruleset, a software deployment may use App Hub entries. Chapter 8 documents each in detail.
Permissions
NetLock RMM uses a role-based permissions model. Each user holds a set of permission flags that gate access to Console features. Flags come in three shapes:
*_enabled— whether the user sees the feature at all (for examplecollections_enabled).*_add— whether the user can create new items in the feature.*_manage— whether the user can edit or delete existing items.
Permission flags control which items appear in the navigation menu on the left, which buttons are visible on a page. A user without dashboard_enabled will not see the Dashboard menu item; a user with collections_application_control_enabled but without collections_application_control_manage will see the Application Control page read-only.
Permission names appear throughout this manual in backticks, for example collections_application_control_manage. See Users & Roles for how to assemble permissions into roles, and the Permission reference appendix for a full list.
Real-time updates
Several parts of the Console update in real time using a persistent connection to the server. Device status, script and job execution results, and policy deployment notifications all flow in without a page refresh.
What to read next
- First-Run Walkthrough — apply these concepts to a fresh deployment.
- Navigating the Console — where each concept lives in the UI.
- Glossary — one-line definitions for quick lookup.
First-Run Walkthrough
This chapter takes you from your first login all the way to a managed device that is online, labelled, and has a policy applied. It assumes the server is already running (whether cloud or self-hosted).
Before you start, read Core Concepts if you have not already. Every step below uses terms introduced there.

Step 1 — Sign in
Open the Console in your browser. The login screen accepts either an username or email address and password, or a configured single-sign-on provider if your organisation has enabled SSO.
- Enter your email in the
Emailfield. - Enter your password in the
Passwordfield and sign in. - If your account has two-factor authentication enabled, enter the current code from your authenticator app on the next screen.
- If your organisation uses SSO, click the SSO button on the login page instead and complete the provider's flow.
You land on /account/home, a small personal dashboard showing your profile information, navigation order menu and email signature configuration for the ticketing system.
Note: If you are the very first user on a self-hosted deployment, the initial administrator credentials were set during server installation. Default username is: "admin" and default password is "admin".
Step 2 — Complete the Setup Wizard
The first time an administrator visits the Dashboard page, the Setup Wizard opens automatically. It walks you through the minimum configuration needed to get the product useful:
- Create a tenant (if none exists yet).
- Create a location under that tenant.
- Create a group under that location.
- Optionally generate an agent installer for one of your supported platforms.
If you dismiss the wizard, the same steps are available manually from the Tenants menu and the Agent Download dialog. The wizard is simply a faster path.
Tip: Name your first tenant deliberately. It is common to use the company or customer name. You can rename it later, but external integrations (for example reports emailed to stakeholders) use the name you set here.
Step 3 — Create a tenant, location, and group
If you skipped the wizard, do this manually:
- In the left-hand navigation, open
Tenants. - On the
Manage Tenantspage, click the add button and fill in the tenant name and basic details. Save. - Select the new tenant in the list to enter its detail view. The Console stores the selection so subsequent screens act on this tenant.
- Open
Location Settingsand add a location — typically a physical site ("Berlin HQ", "Remote Workers"). - Inside the location, add one or more groups. Groups should reflect how devices will be configured; a good starter set is
Workstations,Laptops, andServers.
See Chapter 4 for the full reference on the tenant page and its dialogs.

Step 4 — Generate an agent installer
With a target group in place, you can generate an installer that pre-configures the agent to register into that specific tenant, location, and group. NetLock RMM ships the agent as a single self-contained executable per platform and architecture, with the server configuration embedded at build time.
- Open the Agent Download dialog from the Setup Wizard or from the
Devicespage. - The dialog runs as a five-step wizard. Step through:
- Configuration name — a label for this installer build.
- Deployment method — select the target tenant, location, and group.
- Target server — select the communication, remote, update, trust, file, and relay servers this agent will talk to.
- Authorization — choose whether the agent is pre-authorized or registers as unauthorized pending admin approval.
- Platform and architecture — choose one of
win-x64,win-arm64,linux-x64,linux-arm64,osx-x64,osx-arm64. Also choose Standard Installer (console, silent-capable) or GUI Installer (graphical, with customisable window title, welcome message, and button labels).
- Click the build action. The Console packages a binary with the embedded config into a
.zipand returns a download link. - Optionally download an accompanying install script —
Install-NetLockAgent.ps1for Windows,Install-NetLockAgent.shfor Linux or macOS — that automates the download, extract, and run steps.
Warning: Treat agent installers like secrets. The server configuration is embedded inside the binary, so anyone with the
installercan register a new device into the configured group, depending on your configuration settings. You can also set a installer to auto authorize until a certain date and all installations originating from the specific installer will first land underunauthorized devices.
Step 5 — Install the agent on a device
On the target device, copy the .zip, extract it, and run the binary with administrator or root privileges.
Windows (PowerShell, elevated):
Expand-Archive .\NetLockAgent.zip -DestinationPath .\NetLockAgent
.\NetLockAgent\NetLock_RMM_Agent_Installer.exe
For silent, unattended deployment via GPO, Intune, or Ansible, add flags:
.\NetLock_RMM_Agent_Installer.exe --hidden --no-log--hidden/-h— hide the console window (Windows only).--no-log/--nolog— delete installer logs after completion.--temp <path>/-t <path>— use a custom temporary directory.
Linux / macOS (Bash, with sudo):
unzip NetLockAgent.zip -d NetLockAgent
chmod +x NetLockAgent/NetLock_RMM_Agent_Installer
sudo ./NetLockAgent/NetLock_RMM_Agent_Installer
With no arguments the installer uses its embedded config. For manual re-configuration or repair, the installer also accepts positional modes: clean "<path-to-server_config.json>" for a fresh install with an external config, fix "<path>" to repair while preserving the existing server config, and uninstall to remove the agent.
The installer registers the agent as a background service (Windows service, systemd on Linux, LaunchDaemon on macOS) and starts it. Within a minute or two the agent contacts the server.
Note: NetLock RMM does not ship native
.msi,.deb,.rpm, or.pkgpackages; a single binary is used across all distributions.
Back in the Console, the device does not appear in Devices yet — it appears in Unauthorized Devices instead, unless you chose pre-authorization in step 4's wizard. This is by design: an administrator must explicitly approve any agent that claims membership in a tenant, to prevent rogue or misconfigured agents from polluting your inventory.
Step 6 — Approve the unauthorized device
- In the navigation, open
Devices → Unauthorized Devices. - Locate the new entry. It shows the device's hostname, operating system, and the tenant / location / group the agent was configured for.
- Select the entry and approve it. Optionally adjust the target group before approval if the agent was configured against the wrong one.
- Give the new device a human-readable label using the Edit Label dialog — for example
MARKETING-LAPTOP-01becomesAnna's laptop.
The device now appears in the main Devices list and reports status in real time. See Chapter 3 for the full Devices reference.

Step 7 — Create a policy and route it with an automation
With the device authorised, give it a policy. This takes two pieces in NetLock RMM: the policy itself (what should be enforced), and an automation rule that routes the policy to the right devices.
7a — Create the policy
- Open
Policiesfrom the navigation. - On
Manage Policies, click Add. Enter a name and description — for exampleStarter Workstations. Save. - Click Manage on the new row to open
Policy Settings. - The default settings enforce the agent configuration but do not yet configure Antivirus, Application Control, Patch Management, or any other opt-in feature. Feel free to set your first settings. On a later stage you can edit the policy again to activate specific sensors or jobs.
- Save.
7b — Route the policy with an automation
- Open
Automationsfrom the navigation. - Click Add. Fill in:
NameandDescription.Condition— chooseGroup.Expected result— enter the exact name of the group you created in step 3, for exampleWorkstations.Trigger(policy) — selectStarter Workstations.
- Save.
The server immediately re-evaluates every connected device against the new automation and pushes the matching policy. Within the agent's next poll interval the policy lands on the device.
Note: NetLock RMM evaluates automations in priority order and picks the first match. If you create multiple automations that could all match a device, order matters.
See Chapter 6 for the full Policies reference, Chapter 5 for the Automations reference, and Guide H.4 for a step-by-step walk-through.
Step 8 — Verify the policy arrived
Finally, confirm the pipeline worked:
- Open
Devices -> Authorizedfrom the navigation. - The column called
Policyindicates what policy is currently assigned to the device.
If the expected policy is not displayed there, check your automations order.
Or see Troubleshooting for deeper diagnostics.
What you have now
At the end of this walkthrough you have:
- A tenant with one location and at least one group.
- One managed device, labelled and approved.
- A policy attached to the group.
That is the smallest meaningful deployment of NetLock RMM. Everything else — automations, patch management, scripts, reporting — layers on top of this foundation. The next chapter, Navigating the Console, describes the UI you will spend the rest of your time in.
Navigating the Console
The Console has a consistent layout across every page. Learning where the fixed elements live — the navigation menu, the tenant selector, the theme toggle, the help dialog — means you can find any feature in a few clicks. This chapter is the short tour.

The overall layout
Every page shares the same shell:
- A header along the top with the product logo, the tenant / location / group selector, the theme toggle, and access to your profile and help.
- A left-hand navigation menu grouping every feature area the product exposes.
- A main content area to the right, where the currently opened page renders.
- A footer with product and build information.
You can resize the navigation, and the Console remembers your preference. The header remains visible on every page.
The navigation menu
The navigation menu on the left is built dynamically: the items you see depend on your permissions, the modules enabled on the deployment, and the order you chose to display them in. Two users with different permission sets on the same deployment will see different menus.
The default top-level groups, in their default order, are:
DashboardDevices Quick Access— withAll Devices,Unauthorized Devices, andDevice World Mapsub-items.TenantsAutomationsPoliciesPatch ManagementCollections— Scripts, Jobs, Sensors, Custom Fields, App Hub, Application Control, Device Control, Software Deployment.File Server & Monitoring— File Server, Relay Server, Website Uptime, Port Scanner.Tickets(only if the Ticket System is enabled)ReportsManagement— Events, Audit, Users.Settings— 16 sub-pages covering administration.
Each group expands to reveal its sub-pages. Selecting a sub-page loads it into the main content area.
Note: Menu visibility is gated by roughly twenty permission flags at the top level, plus additional flags per sub-page. See the Permission reference appendix.
Customising menu order
The Console stores a per-user menu order in your account — the default order is the one listed above, and the server loads your personal order on every login. You can edit the order under /home.
The "Go Pro" upgrade button
If the deployment is unlicensed, a gold Go Pro button appears prominently in the navigation. Clicking it opens the upgrade / licensing flow. Once the deployment is licensed, the button disappears.
The tenant selector
Many pages — Tenant Settings, Location Settings, the Devices page, most Collections pages — act on a currently selected tenant, location, and group. The selector in the header is how you pick them.
- Click the selector in the header to open a tenant / location / group picker.
- Choose the tenant, then narrow to a specific location or group if desired.
- The selection persists across the session and is used by every context-sensitive page you open afterwards.
A few pages also show the selected context inline near the top of the content area, so you always know what you are acting on.
Tip: If a page says "no tenant selected" or shows an empty state unexpectedly, open the header selector first and pick a tenant.
Dark mode
A theme toggle in the header switches between light and dark mode. Your preference is stored in your user account, so the theme is consistent across devices and sessions.
If the deployment has been whitelabeled (see A.6 Whitelabeling & themes), the brand colours apply in both modes. Custom community themes imported via the whitelabeling settings also respect the light/dark split.
Help and support
Help is available from the header via the in-app support dialog.
- Contact support — an in-app form for contacting our support team.
- Update available — appears when a new Console or server version is available, with a short summary and a link to the update flow.
- Subscription reminder — surfaces subscription renewal information on deployments that require it.
For deeper issues, the Troubleshooting appendix enumerates the common failure modes with diagnostics.
Notifications and toasts
Short-lived status messages appear as toast notifications in a corner of the screen — for example "Policy saved" after saving a policy, or an error after a failed bulk action. Toasts disappear after a few seconds; for historical records, check Events or Audit.
Real-time Console features (device status, script execution results, policy deployment feedback) use a persistent connection to the server. If toasts or status indicators stop updating, refresh the page to re-establish the connection.
Keyboard shortcuts
The Console does not define global keyboard shortcuts. There is no product-wide dark-mode toggle, command palette, or save/close binding. Keyboard handling is limited to page-local conveniences — for example, pressing Enter submits the login form, and the remote control window binds function keys relevant to that session. Each per-page shortcut is noted in the chapter that documents that page.
Where to go next
You now know the shell of the Console. From here, jump to whichever feature area matters most:
- Chapter 2 — Dashboard — the default landing page for most users.
- Chapter 3 — Devices — inventory, approvals, remote access.
- Chapter 4 — Tenants, Locations & Groups — managing the hierarchy.
- Part III — How-To Guides — task-oriented walkthroughs.
Dashboard
The Dashboard is the default landing page for most users. It is a grid of panels — configurable widgets — that display information from the Console's database: device counts, sensor values, event slices, and anything else you can express as a SQL query. Each user can create multiple dashboards, each with its own set of panels, and arrange them in an explicit layout mode.

Requires permission: the dashboard must be enabled for your user. A user without this permission does not see the
Dashboardmenu entry.
Overview
The Dashboard page sits at /dashboard. At the top is a bar of dashboards you have created; the active dashboard shows below it as a grid of panels. Dialogs handle creating and deleting dashboards and adding or configuring panels.
The first-run Setup Wizard
The first time a newly provisioned administrator opens the Dashboard, the Setup Wizard opens automatically. It walks through the minimum configuration needed to make the product useful — creating a first tenant, location, and group, and optionally downloading an agent installer. See First-Run Walkthrough for the full sequence.
You can close the wizard and reopen it from the help area later. If your environment is already set up, dismiss it and proceed directly to the empty dashboard.
Creating a dashboard
A fresh user starts with one empty default dashboard. You can create more so that different roles or different periods of the day get their own view (for example a "morning triage" dashboard and a "server health" dashboard).
- Click the add button in the dashboard bar to open the Add Dashboard dialog.
- Enter a name in the dashboard bar.
- Save. The new dashboard is active and empty, ready for panels.
Dashboards are per-user. Two users do not share each other's dashboards unless an administrator configures defaults (see A.12 Content defaults).
Deleting a dashboard
- Open the dashboard you want to remove.
- Use the delete action to open the Delete Dashboard confirmation.
- Confirm. The dashboard is removed immediately along with all panels it contains.
Warning: Deleting a dashboard cannot be undone. The panels you configured are lost. Recreate them from the Panel Builder if necessary.
Adding and configuring panels
Panels are the individual widgets that make up a dashboard. Use the Panel Builder to add or reconfigure them.
- On the active dashboard, click the add-panel affordance.
- The Panel Builder opens.
- Choose a panel type:
chartortable. Forchart, also pick a chart sub-type:bar,line,area,pie,doughnut, orradar. - Build the data query. The Panel Builder exposes a SQL query builder with:
- aggregate functions
COUNT,SUM,AVG,MIN,MAX, andDISTINCT; - filter operators
=,!=,<,>,<=,>=,LIKE,NOT LIKE,IS NULL,IS NOT NULL; - joins
INNER JOIN,LEFT JOIN,RIGHT JOIN; ORDER BYdirectionASCorDESC.
- aggregate functions
- For chart panels, configure the label column and value column that map the query rows onto the chart axes or slices.
- Configure display settings — colours, legend position, legend visibility, axis labels, fill (area / line), line tension (line / area).
- Configure the panel size in the dashboard grid:
Widthin grid columns (1-12) andHeightin pixels (200-1200). - Save. The panel appears on the dashboard and renders from its query.
Panel types at a glance
| Type | Sub-type | Best for | Data shape |
|---|---|---|---|
| chart | bar | Ranked counts across categories | label + value |
| chart | line | Trend over time | label (time) + value |
| chart | area | Trend over time with emphasised volume | label (time) + value |
| chart | pie | Proportional breakdown | label + value |
| chart | doughnut | Proportional breakdown, ring style | label + value |
| chart | radar | Multi-axis comparison | label + value |
| table | — | Raw rows with many columns | any |
Rearranging panels
Panels are laid out in a responsive grid. To reposition or resize them:
- Click
Edit Layoutin the dashboard header to enter layout mode. - Adjust each panel's width (1-12 columns) and height (200-1200 pixels) using the inline numeric fields that appear on every panel.
- Click
Exit Layout Modeto save the layout.
Layout is stored per-user per-dashboard; your layout does not change what other users see on their own dashboards.
Common tasks
Set up a tenant-overview dashboard for an MSP
- Create a new dashboard named after the tenant.
- Add a device-count panel scoped to that tenant.
- Add an event feed panel filtered to that tenant's devices.
- Optionally add sensor panels for critical devices (a file server's disk usage, a domain controller's CPU).
- Switch between per-tenant dashboards via the dashboard bar as you move through your queue.
Build a quiet "watch list" dashboard
- Create a dashboard named
Watch list. - Add quick-access panels that link to the specific devices you are currently watching after a policy rollout or software deployment.
- Add an event feed filtered to the same devices.
- Remove the dashboard when the watch window ends.
Reset a cluttered dashboard
If a dashboard has grown unwieldy, the simplest path is to create a fresh one from scratch and delete the old one. Panels are cheap to recreate with the Panel Builder, and the fresh start forces you to keep only the panels you actually use.
Permissions and conditional behaviour
- Access to the Dashboard is gated by a user-level permission. Users without it do not see the page or the menu entry.
- The panels you can add depend on the data you are permitted to see. For example, a user scoped to a single tenant will only see that tenant's devices in a device-count panel, regardless of how the panel is configured.
- The Setup Wizard is only shown on the administrator's first visit to the Dashboard and can be dismissed.
Related chapters
- Devices — what device-count and device-list panels reference.
- Sensors under Collections — the source of sensor panels.
- Events & Audit — the source of event feed panels.
- A.12 Content defaults — configure system-wide default dashboards.
Managing Devices
The Devices section is where most day-to-day RMM work happens. It covers the inventory of managed devices, the queue of agents waiting to be approved, device detail views with status and events, bulk operations such as reboot or shell commands, remote desktop sessions, and a world map showing where your devices are located geographically.
The section is exposed as a top-level menu group with three sub-pages:
| Page | Route | Purpose |
|---|---|---|
Devices | /devices | Inventory of authorized devices. |
Unauthorized Devices | /unauthorized_devices | Queue of agents pending approval. |
Device World Map | /device-world-map | Geographic view of device locations. |
All three pages respect the currently selected tenant, location, and group context from the header selector. See Navigating the Console for how the context works.

3.1 Device inventory, filters, and labels
The Devices page lists every authorized device for the selected tenant / location / group. Each row shows status, identifying information, and quick-action affordances.
Status indicators
Each device reports status in real time:
- Online — the agent is currently connected to the server.
- Online + Remote connected (pulsing) — the agent is currently connected to the server and has a remote connection established
- Offline — the agent has not checked in within the expected interval.
Status changes appear without a page refresh (the page uses the Console's real-time update channel). If status updates stop arriving, a page reload re-establishes the connection.
Filtering and searching
The Devices list offers two filter controls: a free-text search box and an online-only toggle.
The search box performs a case-insensitive contains match across 13 fields at once — enter any substring and rows where any of the following fields contains it remain visible:
- device name and label
- tenant, location, and group name
- agent version and last-access timestamp
- IP address, operating system, and domain
- antivirus solution and firewall status
- last active user
The online-only toggle, when enabled, restricts the list to devices whose status is currently Online + Remote connected. Combined with a search term, it narrows the list to online devices matching the search text.
Labels
Every device can carry a human-readable label. Rename it to something meaningful (Anna's laptop, Warehouse POS 3) using the Edit_Label dialog.
- Select the device in the list.
- Right click the label and open
Edit_Label. - Enter the new label and save.
Tenant / location / group assignment
Every device belongs to exactly one group, in exactly one location, in exactly one tenant. To move a device between groups, use the group assignment affordance on the device. Moving a device may change which policy it receives, because policy assignment is driven by Automations that match on device attributes such as group name. Expect policy changes to land within the device's sync interval.
3.2 Unauthorized devices and the approval flow
An agent that successfully contacts the server but has not yet been approved appears in Unauthorized Devices, not in the main Devices list. This intermediate state prevents rogue or misconfigured agents from silently polluting your inventory.

The approval flow is:
- The agent is installed on a device with configuration that targets a specific tenant / location / group.
- The agent contacts the server and registers as unauthorized.
- An administrator reviews the entry in
/unauthorized_devices— confirm the hostname, operating system, and the target tenant / location / group are correct. - Adjust the target group if needed.
- Approve the entry. The device is created in the authorized inventory and begins receiving policies and automations.
- Optionally set a label immediately after approval using the
Edit_Labeldialog.
Rejecting an unauthorized device removes it from the queue; the agent will re-register on its next poll and reappear unless you block it at the network or agent level.
See the First-Run Walkthrough for a full end-to-end example, and Guide H.2 for a task-focused recipe.
3.3 Device detail view
Selecting a device in the list opens its detail view. The detail view pulls everything the Console knows about the device into one place:
- Identifying information — hostname, label, tenant / location / group assignment, operating system, last-seen timestamp, IP addresses reported by the agent.
- Status — current online / offline / error state, and the agent version.
- Custom fields — values for every custom field defined in Collections, editable per device.
- Events — recent operational events scoped to this device; a link into the full Events page is available.
- Policy — the single policy currently assigned to the device (or
no_assigned_policy_foundif no automation matched). See Chapter 5 — Automations for how assignment works. - Actions — per-device operations: remote control, remote shell, file browser, registry editor, event log viewer, service manager, wake-on-LAN, uninstall application, SNMP tools, and the bulk affordances covered in 3.4 and 3.5.
The per-device actions are implemented as the dialog set below. Each dialog targets the currently selected device (or the set selected for bulk actions):
| Category | Dialogs |
|---|---|
| Lifecycle and assignment | Edit Label, Move Device, Move Devices (bulk), Remote Authentication |
| Remote control | Remote Control |
| Remote shell | Remote Shell, Shell History, Bulk Remote Shell, Bulk Remote Shell Results |
| Remote file browser | File Browser, Create File, Create Directory, Rename File, Rename Directory, Move File, Move Directory, View File, operation results |
| Remote registry editor (Windows) | Registry Editor, Create Key, Create Value, Edit Value |
| Remote event log (Windows) | Event Log viewer, Event Details, Event Log Statistics |
| Services management | Service Editor (Windows), Service Editor (Linux / macOS) |
| Diagnostics and tools | Event Details, SNMP Tools, Uninstall Application |
| Network | Wake on LAN |
The exact availability of some dialogs depends on the device's operating system — for example the Registry Editor is Windows-only, and the Linux / macOS Service Editor applies only to Linux and macOS devices.
Editing custom fields on a device
- Open the device detail view.
- Scroll to the custom fields area.
- Edit the value inline, or open the custom-field editor for richer types (for example a date picker).
- Save. The new value is recorded and visible in reports and panels that reference the field.
Defining which custom fields exist happens at the Collections level; see Chapter 8 — Custom Fields.
Viewing per-device events
The detail view shows a tailored slice of the Events feed: only events concerning this device. This is usually where you go first to diagnose why an action did not land — a policy deployment that silently failed, a script that did not run, a sensor that went silent.
For the full events reference, see Chapter 12.
3.4 Bulk actions
Rather than operating on devices one at a time, the Devices page supports selecting many devices and issuing a single operation against all of them. Common bulk actions include:
- Bulk remote shell — execute a command on every selected device and collect the results.
The bulk remote shell flow uses two dialogs:
- Bulk Remote Shell — pick the command to run, confirm the target set, and launch.
- Bulk Remote Shell Results — display per-device results as they arrive, including stdout, stderr, and exit status.
Warning: Bulk actions run on every selected device without further per-device confirmation. Double-check the selection before you launch a bulk reboot on a production fleet.
Tip: For repeatable work, save the command as a script in Collections and invoke the script rather than typing the command every time.
3.5 Remote control and remote shell
Individual devices support remote access via the Console:
- Remote shell — an fire and forget shell session on the device (PowerShell on Windows, Bash or the default shell on Linux and macOS), opened from the Remote Shell dialog. Command history for the device is available from the Shell History dialog.
- Real-Time Remote shell — an interactive shell session on the device (PowerShell on Windows, Bash or the default shell on Linux and macOS), opened from the Remote Shell dialog. Command history for the device is available from the Shell History dialog.
- Remote control — a graphical remote-control session to the device's desktop, opened from the Remote Control window.
How remote control works
NetLock RMM does not use VNC or RDP for remote control. Instead it streams the device's screen over its own protocol using one of two video encodings:
- H.264 — hardware-accelerated on the device's GPU when available, with a CPU software encoder as fallback. H.264 is the default when the agent and relay can negotiate it.
- JPEG polling — used when H.264 is not available (for example when the H.264 slot on the relay is already in use), and also the mode used by the legacy transport.
The Remote Control window exposes a connection-mode dropdown with two options:
Relay (Recommended - faster)— the session is routed through a dedicated Relay Endpoint that sits between the Console and the agent. This is the fast, modern path and is always preferred when the relay is configured.SignalR (Legacy - fallback)— the session is routed through the Console's own SignalR hub on the main server. This path is slower and always uses JPEG polling.
Selection is explicit: you pick the mode before starting the session. The Relay path auto-falls-back to JPEG if the relay's single H.264 slot is already occupied, and to SignalR + JPEG if the relay cannot be reached at all.
See Chapter 9 — Relay Server for how to deploy and manage the Relay App, and A.7 Remote screen control for authentication and default-settings reference.
3.6 The Device World Map
The Device_World_Map page at /device-world-map visualises your fleet geographically. Each device is plotted on a world map based on IP-geolocation data captured when it reports to the server.

Use cases include:
- Confirming a device claims to be where you expect it to be (an unexpected pin in another country is a useful signal).
- Assessing the impact of a regional issue — for example, how many devices are on a specific coast during a power event.
- Communicating fleet spread to non-technical stakeholders in a single screenshot.
The map respects your tenant / location / group context: selecting a tenant in the header narrows the map to that tenant's devices only.
Note: Map accuracy depends entirely on the quality of IP geolocation for the device's external IP. Devices behind a VPN will appear at the VPN exit rather than the physical device location. The IP lookup happens locally on your NetLock RMM server. IP lookups are never communicated to the outside world.
Permissions
Device-related permissions follow the standard pattern:
- A top-level permission enables the Devices section.
- Per-action permissions gate bulk actions, remote shell, remote desktop, approvals, and label editing.
- Tenant-scoped users only see devices in tenants they have access to.
See the Permission reference for the full list.
Related chapters
- Chapter 4 — Tenants, Locations & Groups — the hierarchy devices live in.
- Chapter 6 — Policies — how policies flow to devices.
- Chapter 8 — Collections — scripts, sensors, and custom fields that extend what a device exposes.
- Chapter 9 — File Server & Monitoring — relay-mediated remote access.
- Chapter 12 — Events & Audit — per-device event and audit records.
Tenants, Locations & Groups
NetLock RMM organises every managed device into a three-level hierarchy: tenant, location, group. This chapter is the canonical reference for creating and managing that hierarchy. The hierarchy drives how policies, automations, and permissions are scoped, so getting it right early pays off for the life of the deployment.

4.1 The hierarchy, in brief
A quick refresher from Core Concepts:
- A tenant is the top-level organisational container. For an in-house IT team this usually maps to the company; for an MSP it maps to a customer.
- A location is a subdivision of a tenant — typically a physical site or office.
- A group is a subdivision of a location — typically reflecting how devices should be configured (
Workstations,Servers,Laptops) rather than where they physically sit.
Every device belongs to exactly one group. Configuration — policies, automations, scripts — can be applied at any level and flows down: a policy on a tenant applies to every device in every location and every group of that tenant.
Tip: Keep groups focused on configuration intent. If a single policy applies to every device regardless of site, one group per location is plenty. If policies differ by device type, create device-type groups inside each location.
4.2 Managing tenants
The Manage Tenants page at /tenants is the entry point. It lists every tenant you have permission to see, along with summary information (device counts, last activity).
Creating a tenant
- Open
Tenantsfrom the navigation. - Click the add affordance on the
Manage Tenantspage. - Fill in the tenant name and any additional details required by your deployment.
- Save.
The newly created tenant starts empty — no locations, no groups, no devices.
Editing a tenant
Select a tenant in the list to enter its detail view. From there you can rename it, change its contact information, or adjust tenant-wide settings (covered in 4.3). Editing a tenant does not affect its devices or their assignments; only the tenant metadata changes.
Deleting a tenant
Deleting a tenant is rare but supported. Before deleting, confirm:
- The tenant has no active devices you still care about.
- No reports, scheduled deliveries, or automations reference the tenant.
- You have archived any customer data you may need later — device inventory from the Devices page, events from Events & Audit, and any reports from Reports. (The tenant-list export at 4.5 only captures tenant metadata, not the data under the tenant.)
4.3 Tenant settings
Tenant-level configuration lives on the Tenant Settings page at /tenant_settings. The page requires a tenant to be selected in the header context; if none is selected, choose one first.
The page has a flat layout with three sections:
- General Information — editable fields for the tenant's
name,company, anddescription. This is the metadata the rest of the Console refers back to (the name shown in reports, in exports, in the navigation selector). - Contact Persons — five contact-person slots with editable details. These are used as recipients and fallback contacts for tenant-scoped notifications and reports.
- Locations — a searchable table listing every location under this tenant, with a
Manageaffordance on each row that opens the location's detail view (see 4.4). You can add a new location directly from this table.
There are no separate tabs for branding, notifications, integrations, or agent configuration on the Tenant Settings page. Those concerns live elsewhere:
- Branding and themes: deployment-wide in A.6 Whitelabeling & themes.
- Notification channels and recipients: deployment-wide in A.8 Notifications deep dive.
- Agent configuration: per-installer in the Agent Download wizard, not a global tenant setting.
Per-tenant isolation
Tenant metadata and contact persons are isolated per tenant: editing them in one tenant has no effect on another. For system-wide defaults that populate new tenant records, see A.12 Content defaults.
4.4 Locations and groups
With a tenant in place, add locations and groups beneath it.

Adding a location
- Open the tenant and navigate to
Location Settings(route/location_management/*/location_settings). - Use the add-location affordance.
- Enter a location name that reflects the site —
Berlin HQ,Remote Workers,Datacenter A. - Save.
Locations are freeform; use as many as the geography of your deployment warrants. An MSP managing a customer with three offices typically creates three locations.
Editing and deleting a location
Standard edit and delete affordances apply. Deleting a location removes its groups; any devices in those groups lose their group assignment and must be reassigned before configuration flows to them again.
Adding a group
- Open the parent location in
Location Settings. - Use the add-group affordance.
- Enter a group name aligned to the devices it will contain.
- Save.
Groups accept devices immediately. You can now:
- Configure agent installers to target this group (see First-Run Walkthrough step 4).
- Move existing devices into the group from the
Devicespage. - Route policies to the group by creating an Automation whose condition is
Groupand expected value is this group's name.
Moving devices between groups
Use the device-group assignment affordance on the device in the Devices page (see Chapter 3). The agent picks up the new assignment on its next poll and any policies attached to the new group take effect.
Note: Moving a device between groups does not trigger a device reboot or re-authorisation. The agent simply starts receiving a different policy set.
4.5 Exporting the tenant list
The Export Data dialog, opened from the Manage Tenants page, exports the list of tenants you are permitted to see. The scope and contents are narrow: it is not a full tenant archive.
What is exported. One row per tenant, with these fields: id, tenant_name, guid, date (creation date), author (who created the record), description, and company. Devices, policies, events, audit entries, custom-field values, and deployment histories are not part of this export — those live in their own chapters and are exported from there if needed.
Scope. Every tenant that matches your tenants permission list. If you are scoped to specific tenants, the export contains only those. There is no single-tenant-only mode; the dialog always exports the full visible list.
Formats. The dialog asks you to pick one output format:
JSONXLSX(spreadsheet)XMLHTML
Permissions. Any user with access to the Manage Tenants page can run the export. There is no separate export permission flag.
Steps:
- Open
Manage Tenants. - Click the export action to open the Export Data dialog.
- Pick the output format and confirm. The file downloads to your browser immediately — the export runs synchronously, not as a background job.
If you need to archive more than the tenant list — for example a customer's full device inventory or audit trail before offboarding — run the relevant exports from Reports, Events & Audit, or use the export affordances on the specific pages for that data.
Common tasks
Set up a new MSP customer from scratch
- Create a tenant for the customer on
Manage Tenants. - Add one location per physical site the customer operates.
- Add groups inside each location that reflect the device roles you will manage (
Workstations,Servers, etc.). - Open
Tenant Settingsand fill in contact information and any per-tenant defaults. - Generate an agent installer targeted at the intended starter group (see First-Run Walkthrough).
- Deploy the agent on the first device and approve it in
Unauthorized Devices. - Build and apply a baseline policy to the group (see Guide H.4).
Reorganise an existing tenant
- Plan the new structure on paper first — list the new locations and groups and the automations that will route policies to each group.
- Create the new locations and groups in
Location Settings. - Create or update Automations to match the new group names before moving devices, so devices do not sit unassigned after the move.
- Move devices in small batches, verifying policy assignment in the device detail view and policy deployment in
Eventsafter each batch. - Delete the old locations and groups once empty.
Archive and remove a departing customer
- Export device inventory, event history, and any scheduled reports from their respective pages — the tenant-list export only covers tenant metadata.
- Optionally export the tenant list via the Export Data dialog on
Manage Tenantsso you keep a record of the tenant row itself. - Uninstall agents on the customer's devices (outside the scope of this chapter).
- Delete the tenant from
Manage Tenants.
Permissions
Tenant, location, and group operations are gated by a tenant-management permission group. In addition, tenant-scoped user accounts (see Chapter 14 — Users & Roles) only see the tenants they are explicitly permitted to access, which has the side effect of restricting every other feature area to those tenants as well.
Related chapters
- Core Concepts — the tenant → location → group model in context.
- Chapter 3 — Devices — how devices are created, moved, and labelled.
- Chapter 6 — Policies — attaching policies to tenants, locations, and groups.
- Chapter 14 — Users & Roles — scoping user access to specific tenants.
- A.12 Content defaults — system-wide defaults that apply to new tenants.
Automations
Automations in NetLock RMM are a narrow, purpose-built feature. They are not a workflow engine, not a job scheduler, and not an event-action pipeline. Their one and only job is to decide which policy a device receives. If you have used other RMM products, set aside any expectation that "automation" means trigger-driven scripts, ticket creation, or multi-step workflows — in NetLock RMM those responsibilities live elsewhere, and this chapter explains where.

5.1 What an automation is
An automation is a single rule of the form:
IF a device's <attribute> matches <expected value> THEN assign policy <name>Each rule has exactly three pieces of configuration: a condition type (which attribute of the device to compare), an expected value (either a string the attribute must equal, or — for the entity-picker conditions — the specific tenant, location, group, or device the rule targets), and a target policy (the policy to assign when the rule matches). There is no second step, no action chain, and no side effect beyond setting the device's assigned policy.
Note: A policy on its own is inert. Devices only receive configuration when an automation's condition matches them and points to a policy. If no automation matches a device, the device has no policy and the Console shows
no_assigned_policy_foundon its detail view.
Automations are managed on the Manage Automations page at /automations.
5.2 The seven condition types
The condition dropdown exposes seven mutually exclusive options. Each rule picks one. Four of them target an internal entity that you pick from a list (the rule stores the entity's identity, not its display name); the remaining three compare against a string you type.
| Condition | Match style | What you pick or type |
|---|---|---|
Device Name | Entity picker | A specific device from the device list. |
Tenant | Entity picker | A tenant from the tenant list. |
Location | Entity picker | A location under a tenant. |
Group | Entity picker | A group under a location. |
Internal IP-Address | String match | The device's reported LAN IP. |
External IP-Address | String match | The public IP the device appears from. |
Domain | String match | The Windows or DNS domain name. |
Entity-picker conditions (Device Name, Tenant, Location, Group) are immune to renaming. If you rename the tenant Acme to Acme Corp, every rule that targets it keeps working — the rule does not store the name. Conversely, deleting the picked entity orphans the rule.
String-match conditions (Internal IP-Address, External IP-Address, Domain) compare the device's reported value to the Expected result you type, after both sides are trimmed of surrounding whitespace and lower-cased. For the IP conditions, an ::ffff: IPv4-mapped IPv6 prefix is also stripped before comparison, so a device reporting ::ffff:10.0.0.5 matches a rule expecting 10.0.0.5. There is no wildcard, no regex, and no CIDR or range matching — if you need multiple values, create one rule per value.
Tip: Because the comparison is case-insensitive and whitespace-tolerant, you do not need to worry about how the agent capitalizes the domain name or whether the IP literal has a trailing space. You do still need an exact match on the rest of the string.
5.3 How a rule is resolved
When a device syncs with the server, the server walks the automation ruleset in a fixed order determined by condition type, not by any list position you control. Within each condition type, the earliest-created rule wins. The first rule that matches the device determines the policy, and evaluation stops.
5.3.1 Condition-type evaluation order
The server tries the seven condition types in this exact order. As soon as a rule matches, the device receives that rule's target policy and no further conditions are checked:
Device Name— matches the specific device the rule targets.Internal IP-Address— matches the device's reported LAN IP.External IP-Address— matches the public IP the device appears from.Domain— matches the device's reported Windows or DNS domain. Skipped when the device reports no domain.Group— matches the group the device belongs to. Skipped when the device is not in a group.Location— matches the location the device belongs to. Skipped when the device is not assigned to a location.Tenant— matches the tenant the device belongs to. Skipped when the device is not assigned to a tenant.
This ordering is built into the product. It cannot be configured, reordered, or overridden.
5.3.2 Tie-breaking inside a condition type
If you have more than one rule of the same condition type, the rule that was created first wins. The server processes them in creation order and stops at the first match. There is no list-position knob and no "move up / move down" affordance on the Console.
5.3.3 Practical consequences
- Specific beats general by construction. Because
Device Nameis evaluated before everything else, pinning one machine to one policy always wins over a group, location, or tenant rule that would otherwise match. You do not arrange this — the order is intrinsic. - The four network/entity tiers form a natural fallback ladder.
Groupis evaluated beforeLocation, which is evaluated beforeTenant. A device that has both a group rule and a tenant rule gets the group rule; the tenant rule acts as a catchall for devices in that tenant whose group is not separately routed. - String conditions outrank entity conditions.
Internal IP,External IP, andDomainall run beforeGroup,Location, andTenant. A laptop on the office LAN can be steered to a different policy than the same laptop's group rule would assign, simply by adding an internal-IP rule. - Overlap is allowed but not merged. If two rules both match, only the one reached first by the evaluation order applies. Policies never layer or combine.
- A device is assigned at most one policy at a time. See Chapter 6.
- No match is a valid outcome. A device that matches no rule runs without a policy. The server does not invent one and the device shows
no_assigned_policy_foundon its detail view.
Note: Because tie-breaking is based on the rule's internal creation order, you cannot promote a newer same-type rule above an older one from the Console. If two rules of the same condition type both match a device and the wrong one is winning, delete the older rule and recreate it — or change one of the two rules to use a more specific condition type higher up the evaluation order.
5.4 Creating, editing, and deleting a rule
Use the three dialogs on the Manage Automations page:
- Add Automation — opened from the add affordance. Fields:
Name,Description, category (currently alwayspolicy),Condition,Expected result, and the target policy. For the three string-match conditions (Internal IP-Address,External IP-Address,Domain),Expected resultis a text input. For the four entity-picker conditions (Device Name,Tenant,Location,Group),Expected resultbecomes a picker for that entity. - Edit Automation — opened from a row's edit action. Pre-populated with the rule's current values.
- Delete Automation — opened from a row's delete action. Confirmation only.
When AI is enabled in Settings → AI/LLM, both Add and Edit dialogs expose an AI Assistant button that can propose a rule from a natural-language description. The AI only writes into the dialog's fields; it does not save the rule for you.
Note: Adding, editing, or deleting any automation triggers an immediate re-sync of every connected device. Devices do not wait for their next scheduled poll to re-evaluate policy assignment — the change lands right away.
Note: There is no field on this dialog that controls evaluation order. Evaluation order is determined by the condition type you choose (see §5.3) and, within a condition type, by which rule was created first.
5.5 What Automations explicitly cannot do
If you are coming from another RMM, the following list is important. None of these are supported by the Automations feature:
- No event triggers. You cannot configure "when a disk fills up, run this".
- No schedule triggers. You cannot configure "every Sunday at 02:00, do X".
- No webhook or API triggers. External systems cannot kick off an automation.
- No manual triggers. There is no "Run now" button on a rule.
- No script action. Automations never execute a script.
- No notification action. Automations never send an email, Teams message, Telegram message, or webhook.
- No ticket action. Automations never open a ticket.
- No chained steps. One rule has one condition and one outcome — the target policy.
- No scope selector per rule. A rule evaluates against every device; scoping is encoded in the condition (for example
Tenant = Acme). - No execution log. There is no per-automation history view. Policy changes that result from rule evaluation are recorded in general Events (see Chapter 12) and reflected in the device detail panel's
Assigned policyfield.
5.6 Where event-driven and scheduled work actually lives
Because Automations only route policies, every other "when X happens, do Y" pattern is served by a different feature. The three you will reach for most often:
- Sensors (see Chapter 8.3) are the right tool when you want the agent to watch a metric and react. A sensor samples its category on a schedule, raises a notification when the notification threshold is crossed, and runs an action script when the action threshold is crossed. This is how you express "when CPU exceeds 90% for five samples, run a cleanup script".
- Jobs (see Chapter 8.2) are the right tool when you want a script to run on a device on a timetable. A job picks a script and assigns it one of the twelve supported schedules (boot, one-shot date, recurring interval, recurring on specific weekdays, and so on). This is how you express "every Friday at 18:00, rotate the backup script".
- Patch Management handles the "install approved patches on a schedule" case without any automation glue — see Chapter 7 for the approval queue and Chapter 6.12 for the per-policy rollout rules.
Automations compose none of these. They do not call a sensor, queue a job, or trigger a deployment. They only decide the policy a device runs under — which in turn can include jobs, sensors, and patch rules — but the composition is always "automation assigns policy; policy contains everything else".
5.7 Worked example — a three-tenant MSP
Consider an MSP managing three tenants, each with a small office and a mix of workstations and servers. A reasonable, minimal automation set looks like this, grouped by condition type so the evaluation order is visible at a glance:
Tier 1 — Device Name (pin specific machines):
| Condition | Expected value | Target policy |
|---|---|---|
Device Name | ACME-DC01 | Acme Domain Controller |
Tier 5 — Group (the main routing layer):
| Condition | Expected value | Target policy |
|---|---|---|
Group | Acme / Berlin / Servers | Acme Server Baseline |
Group | Acme / Berlin / Workstations | Acme Workstation Baseline |
Group | Globex / HQ / Servers | Globex Server Baseline |
Group | Globex / HQ / Workstations | Globex Workstation Baseline |
Group | Initech / Remote / Laptops | Initech Laptop Baseline |
Tier 7 — Tenant (per-tenant fallback):
| Condition | Expected value | Target policy |
|---|---|---|
Tenant | Acme | Acme Fallback |
Tenant | Globex | Globex Fallback |
Tenant | Initech | Initech Fallback |
How this resolves in practice:
ACME-DC01syncs. The server starts atDevice Name, finds the pin, assignsAcme Domain Controller, and stops. The group and tenant rules below are never reached for this device.- A new workstation joins
Acme / Berlin / Workstations. NoDevice Namerule matches. No IP or domain rule is configured, so those tiers are empty. AtGroup, the rule forAcme / Berlin / Workstationsmatches; the device receivesAcme Workstation Baseline. - A workstation lands in tenant
Acmebut in a group that has no rule yet. TheGrouptier finds no match. TheLocationtier is empty. AtTenant, theAcmerule matches; the device receivesAcme Fallback. - A device outside all three tenants. No rule of any condition type matches. The device receives no policy and the Console shows
no_assigned_policy_found. Adding a tenant for it is the fix.
Tip: Keep the
Tenantfallback tier explicit. A tenant-level catchall rule is far easier to debug than a setup where some devices silently get no policy because no rule happened to match. The fallback also makes the tier ladder (Group→Tenant) visible.
Note: Within a tier — for example, between two
Grouprules — the rule created first wins. You do not get a list-position knob to change this. If two same-condition rules both apply to the same device, the cleanest fix is to make one of them more specific via a higher-tier condition (aDevice Namepin, anInternal IPrule, and so on).
5.8 Editing a policy versus editing an automation
Two distinct edit points, two distinct outcomes:
- Editing a policy changes what every device already assigned to it will receive at next sync. The set of devices is unchanged.
- Editing an automation changes the set of devices a policy is routed to. Every connected device re-evaluates its assignment immediately.
You will rarely need to touch automations once the routing is stable. Day-to-day configuration changes happen inside the policies themselves (Chapter 6).
Permissions
Automations are gated by the following flags (see Chapter 14 and the Permission reference appendix):
automation_enabled— master flag. A user without this flag does not see theAutomationsnavigation entry and cannot reach/automations.automation_add— ability to create a new automation.automation_edit— ability to edit an existing automation.automation_delete— ability to delete an automation.
A user with automation_enabled but neither _add, _edit, nor _delete has read-only access — they can inspect the ruleset without changing routing.
Related chapters
- Core Concepts — the
condition → policymodel in the wider vocabulary. - Chapter 4 — Tenants, Locations & Groups — the attributes most automations match against.
- Chapter 6 — Policies — what the target policy actually controls.
- Chapter 8 — Collections — Sensors and Jobs, where event-driven and scheduled work live.
- Chapter 12 — Events & Audit — where policy changes resulting from automation evaluation are recorded.
Policies
A policy is the central configuration unit in NetLock RMM. Almost every feature you can tune on a device — antivirus behaviour, firewall rules, remote-access capabilities, tray branding, patch rollout, scheduled jobs, monitoring sensors — lives inside a policy. This chapter is the reference for the policy object, the Policies list page, and every tab of the Policy Settings editor.

6.1 What a policy is
A policy is a named bundle of device configuration. The single bundle covers:
- Agent behaviour (sync interval, auto-update, remote-control capabilities).
- Tray icon branding and visibility.
- Windows-specific controls (Microsoft Defender Antivirus, Application Control, USB Device Control).
- Linux-specific controls (UFW firewall).
- Sensors and Jobs attached to the policy.
- Patch Management rollout rules per platform.
- Which App Hub apps the tray icon exposes on devices under the policy.
A few rules about policies are load-bearing across the whole product and worth stating up front:
- A device is assigned at most one policy at a time. Policies do not layer, merge, or inherit. The agent runs the one policy assigned to it, or no policy at all.
- Policies do not attach to tenants, locations, groups, or devices directly. Every assignment flows through an automation — see Chapter 5. There is no "apply to group" affordance on the Policies page, the Groups page, or the Devices page.
- There are no policy templates. New policies start blank. The only way to seed a new policy from an existing one is to duplicate.
- There is no versioning, no change history, and no rollback. Edits apply in place. If you need a safety net, duplicate the policy first.
- The
Authorcolumn is informational, not an ACL. It records who created the policy. Edit and delete access are gated by thepolicies_editandpolicies_deletepermission flags, not by authorship — any user with those flags can edit or delete any policy. Visibility of the row is gated bypolicies_enabled.
Tip: Treat the duplicate-before-editing habit as a convention. Because there is no rollback, a duplicated copy is your only path back from a bad change — and duplication takes about two clicks.
6.2 The Policies list page
The Manage Policies page at /policies lists every policy in the system. The table shows:
| Column | Sortable | Notes |
|---|---|---|
Name | Yes | The policy name used by automations to reference this policy. |
Description | Yes | Free-text description set at creation. |
Author | Yes | The user who created the policy. |
Created | Yes | Creation timestamp. |
Actions on the page (toolbar above the table):
- Add opens the Add Policy dialog. Fields:
Name,Description. Save creates a blank policy — every tab of the editor is at its default state. - Manage navigates to the
Policy Settingseditor for the selected policy (/policy_settings). Duplicate and Delete actions live inside that editor, not on this list — see §6.3. - Export (download icon) opens the export dialog. It exports the policy list — one row per policy, with the columns above — as JSON, XML, or HTML. This is a list export, not a full policy export; the contents of each policy's tabs are not included in the dump.
Note: The list page does not expose a Delete or Duplicate button. To delete or duplicate a policy you must open it via
Managefirst.
6.3 A tour of the Policy Settings editor
The Policy Settings editor at /policy_settings is a tabbed workspace. Eight top-level tabs cover the entire surface of what a policy can configure. Every tab is kept alive once opened, so you can switch between tabs and your in-progress edits are preserved until you save or navigate away.

Above the tab strip sits the editor toolbar:
- Back returns to the
Manage Policieslist without saving. - Save (visible when
policies_editis granted) commits all in-progress edits across every tab in one go. Until you click Save, your changes are held in the editor's in-memory state and are lost on a hard reload. - Duplicate (also
policies_edit) opens the Duplicate Policy dialog. The dialog pre-fills the new name as<original> (Copy), which you can override; it then clones the policy as a new row. Duplication is the only "starting point from an existing policy" mechanism. - Delete (requires
policies_delete) opens the Delete Policy confirmation. Deletion cannot be undone. If any automation targets the deleted policy by name, devices matching that automation start reportingno_assigned_policy_founduntil the automation is updated.
Warning: Deleting a policy does not rewrite automations that reference it. Clean up automations before you delete a policy, or audit them afterwards.
TODO: Engineering review — the Duplicate flow does not copy the
device_control_settings,linux_firewall_settings, orapp_hub_settingscolumns in the current release. Confirm whether this is intentional; if not, document the omission.
The eight tabs:
- Agent. General agent behaviour and remote-control capability toggles. Every policy touches this tab.
- Tray Icon. End-user tray behaviour and branding. Applies to every device under the policy.
- Windows. Windows-only features, grouped into three sub-sections — Microsoft Defender Antivirus, Application Control, USB Device Control. Settings in this tab have no effect on Linux or macOS devices.
- Linux. Linux-only features — currently UFW firewall configuration.
- Sensors. SNMP sensor configuration attached to the policy.
- Jobs. Scheduled job definitions attached to the policy.
- Patch Management. Per-platform rollout rules — Windows, Linux, macOS, Docker — each with its own sub-tabs for general settings, approval filtering, deployment rings, schedule, reboot, notifications, and retry.
- App Hub. Catalogue curation — which apps from the global App Hub appear in the tray icon for devices under this policy.
Each tab is documented in its own section below.
6.4 Agent tab
The Agent tab controls the behaviour of the agent process itself. It has two sub-tabs: General and Remote Control.

General. Two knobs:
Sync interval— how often the agent polls the server, in minutes. The allowed range is 5 to 1440 (one day). Short intervals keep the Console responsive to configuration changes; long intervals reduce server load for large fleets.Auto-update agent— whether the agent installs new agent versions when the server offers them. Leave this on in most environments; disable only when you need to pin devices to a specific agent build for testing.
Remote Control. A master toggle and a set of per-capability switches:
Enable remote service— master switch for all remote operations on the device. Everything below is gated on this.Remote Shell— permits interactive shell sessions.File Browser— permits remote file transfer.Task Manager— permits remote process management.Service Manager— permits remote service start/stop/restart.Registry Editor (Windows only)— permits remote Windows registry editing.Event Log Viewer (Windows only)— permits remote Windows event log viewing.SNMP Tools— permits SNMP GET / Walk / Monitor operations from the Console.Remote Screen Control— permits remote screen sessions. Exposes anAccess modedropdown with two values:Attended (user confirmation required & tray icon needs to be enabled!)— the on-device user must approve each session, and the tray icon must be enabled in §6.5 for the approval prompt to render.Unattended (no user confirmation required)— the session starts without user interaction.
Note: Remote Screen Control uses H.264 or JPEG over Relay or SignalR; it is not VNC or RDP. See A.7 Remote screen control for the deployment-wide defaults.
Disable the individual capabilities for high-sensitivity devices where you want, for example, a remote shell but not file transfer.
6.5 Tray Icon tab
The Tray Icon tab shapes what end users see on their device. Branding here is per-policy — a single deployment can present different branding to different customers.
![]()
A master Enabled switch at the top of the tab gates everything below — if it is off, the tray icon does not run on devices under this policy.
General. A single field:
Tray Icon Title— text shown in the tray window's title bar.
Buttons. Per-entry visibility for the built-in tray menu items:
Show About Button— surfaces the About entry. When on, theAbout Button Titlefield sets the menu label.Show Exit Button— lets the user close the tray icon. When on, theExit Button Titlefield sets the menu label. Hide the exit button for managed devices where the tray is mandatory.
App Hub. Controls whether the App Hub window is reachable from the tray, and customises the labels inside that window:
Show App Hub in tray context menu— master toggle for the App Hub entry. TheContext menu labelsets the label shown in the right-click menu.- App Hub window text overrides (all leave-blank-for-default):
Window title,Search placeholder,Refresh button,Install button,Update button,Uninstall button.
Note: This section only governs visibility and labels of the App Hub in the tray. The actual catalogue of apps offered to devices under this policy is curated in §6.13.
AI Chat. Controls the optional, end-to-end-encrypted end-user AI assistant reachable from the tray. The chat is off until you enable it here, and every user-facing string can be branded:
Show AI Chat in tray context menu— master toggle for the AI Chat entry, with aContext menu label.- Registration. A terms/privacy text the user must accept before entering credentials, the accept-checkbox label, a confirm-password label, and a customisable "forgot your password and your chats cannot be recovered" warning.
- Identity. Whether the username must be an email address; when off, the tray prompts for a free-form
Usernameinstead. - Password rules. Minimum length and whether an uppercase letter, lowercase letter, number, and/or special character are required.
Default monthly token limit— the starting per-user limit applied to newly registered accounts (operators adjust it later in theCustomer AIdialog).- Additional texts. Every remaining label, button, and status/error message in the tray chat can be overridden (all leave-blank-for-default).
The accounts themselves — activation, per-user and per-tenant token limits, auto-activation, and statistics — are managed in the Console's Customer AI dialog. See Chapter 13.6.
Logo & Icon. A single upload widget accepting PNG, ICO, or JPG up to 256 KB. The uploaded image replaces the default tray icon.
About Interface. Branding for the About window that opens from the tray's About button:
Enable— master switch for the About window.Window Title,Title,Description— free-text fields shown to the user.Show Version,Show Copyright— toggles for the standard footer lines.Close Button Title— text on the dismiss button.
Chat interface. Branding for the AI Chat window that the tray exposes (see Chapter 13):
Loading Message,Window Title,Subtitle— top-of-window text.Show Welcome Message+Welcome Message Text— optional greeting in the chat pane.Input Field Placeholder— placeholder text in the user input box.Enable Settings— exposes a settings menu inside the chat window, with sub-togglesAllow Export Chat History,Allow Copy Chat History, andShow About.
Remote Screen Control. Text shown to the on-device user when a remote screen session is requested or active:
Request Title,Request Message,Accept Button Title,Decline Button Title— the approval dialog shown for attended sessions (see §6.4).Stop Button Title,Support Agent Connected Message— surfaced while a session is active so the user can end it.
Buttons (custom). A managed table of custom tray-menu entries. Each row has Name, Description, Author, Date, Action, Action details. Use Add, Edit, Delete to maintain entries; each entry adds one item to the right-click tray menu mapped to an action (script, URL, etc.).
Logos, icons, labels, and custom buttons are pushed to the agent at the next sync; they do not change mid-session for a user already logged in.
6.6 Windows tab — Microsoft Defender Antivirus
The Windows tab groups three Windows-only feature areas. The largest by far is Microsoft Defender Antivirus. This section walks through its two sub-tabs in full. The other two sub-sections are covered in 6.7 and 6.8.

At the top of the Configuration sub-tab sits a master Enabled switch. When it is off, every field on the Configuration and Notifications sub-tabs renders disabled — the Console still stores your configuration but the agent does not apply any of it. When it is on, the agent synchronises the settings below with Microsoft Defender on every sync interval.
6.6.1 Configuration sub-tab
The Configuration sub-tab is organised into four sections.
General Settings. Settings that do not fit the scanner-specific categories:
- User Interaction —
Show Windows Security Center icon,Show Windows Security Center tray icon. Control whether end users see Defender's own Security Center surface. - Updates —
Check signatures hourly,Allow metered updates. The first forces hourly signature polling; the second lets signature downloads run over connections the operating system classifies as metered. - Other —
Delete quarantine older than 6 months. A retention switch for the Defender quarantine.
Scanner Settings. Behaviour for real-time and on-access scanning:
Directiondropdown —Inbound & Outbound,Inbound, orOutbound. Scopes which traffic direction the network-aware parts of the scanner examine.- File System —
Hash computing,Block at first seen(permanently disabled in the UI in the current release),Scan archives,Scan emails. These toggles control the deep-scan behaviours most often tuned for performance. - Network —
Scan network files,Filter incoming connections,Datagram processing. Network-scanning knobs; most useful for servers. - Parser — per-protocol toggles for
TLS,RDP,SSH,HTTP,DNS, andDNS over TCP. Enable or disable Defender's parsing of each protocol.
Exclusions. A managed list of paths and process patterns the scanner skips.

The table has columns Exclusion, Type, Description, Date. Actions on the toolbar:
- Add opens the Add Exclusion dialog. Fields:
Type(one ofFile,Directory,File Type (extension), orProcess), theExclusionvalue matching that type, and an optionalDescription. - Edit opens the Edit Exclusion dialog, pre-populated.
- Delete removes the selected row.
- Export exports the exclusion list.
Exclusion types in detail:
File— an exact file path.Directory— a folder path; everything under it is excluded.File Type (extension)— a file extension, for example.bak.Process— a running process image; files accessed by that process are excluded.
Scan Jobs. Scheduled on-demand scans.

The table columns: Status, Name, Date, Description, Schedule Type, Time, Monday through Sunday day toggles, Scan Mode, CPU Usage %, Scan on Battery, Network Drives, Removable Disks, Update Signatures.
Actions:
- Add opens the Add Scan Job dialog. You set:
Enabled,Name,Description, schedule type, day-of-week toggles, time, scan mode, CPU-usage cap, and the battery / network / removable toggles. - Edit opens the Edit Scan Job dialog, pre-populated.
- Delete removes the selected row.
- Export exports the scan-job list.
Each scan job targets a list of directories. Use the Add Directory and Edit Directory dialogs from inside the scan-job editor to maintain the directory list.
6.6.2 Notifications sub-tab
The Notifications sub-tab decides which Defender events the Console surfaces as notifications. It is organised into ten sections — eight Defender event categories plus two NetLock-side controls:
AntivirusAntispywareBehaviourConfigurationPlatformQuarantineReal-time ProtectionScanSignaturesNetLock— channel selector for the events above. The five toggles (E-mail,Microsoft Teams,Telegram,NTFY.SH,Webhook) decide which deployment-wide channels carry this policy's Defender notifications. The channels themselves (server addresses, recipients, tokens) are configured globally inSettings → Notifications— see A.8 Notifications deep dive.

Each Defender category contains a list of per-event toggles — for example Antivirus enabled, Antivirus disabled, Behaviour detected, Quarantine cleared. Toggling an individual event controls whether that specific Defender event generates a notification through the Console's notification system.
Note: Silencing a noisy event category here does not disable the underlying Defender behaviour on the endpoint. It only stops the Console from forwarding the event as a notification. Defender continues to act normally and log the event locally.
6.7 Windows tab — Application Control
The Application Control sub-section of the Windows tab (on-screen heading Application Control (Whitelisting)) controls how a policy enforces application allowlisting on its devices. Ruleset content — the actual allow rules — lives in Chapter 8.6. This tab decides which ruleset to apply and how the agent reacts when an unknown process appears.

Top-level configuration:
Enabled— master switch for this policy.Ruleset— single-select dropdown picking one ruleset (Noneis the default).Auto-whitelist (agent automatically adds running processes to whitelist)withAuto-whitelist untildate — during this window the agent records every running process into the whitelist; after the date passes, only the collected list is enforced.
Actions on unknown process. What the agent does when a process not matched by the ruleset is detected. Toggle any combination:
Terminate processSuspend processDelete binaryBackup binaryDump process memory
Actions on parent process. The same five actions applied to the parent of the offending process — useful for chain-of-execution responses (for example, terminate a launcher that spawned the unknown child).
Matching Filters. Which attributes of a binary are compared against the ruleset. Twelve toggles:
- File:
File Path,File Company,File Product,File Copyright,File Brand,File Product Version,File Version,File SHA256,File SHA512. - Certificate:
Certificate Owner,Certificate Issuer,Certificate SHA1.
Special Filters.
Auto-allow Microsoft signed applications— bypass the ruleset for any binary signed by Microsoft.
Other Settings.
Periodic check interval (minutes)— agent recheck cadence (5–1440).Tray icon notifications— show the on-device user a notification when something is blocked. When enabled, setNotification titleandNotification message. The message supports the placeholders{process_name},{process_path},{actions}, and{count}.
Blocked launch attempts land on the Blocked Applications tab of the Application Control rulesets page in Collections, where an admin can approve them into a ruleset. To author rulesets, edit rules, or approve blocked entries, see Chapter 8.6.
6.8 Windows tab — USB Device Control
The USB Device Control sub-section of the Windows tab (on-screen heading USB Device Control (Whitelisting)) controls how this policy enforces USB allowlisting on its devices. The whitelist itself — entries shared across all policies, scoped by device / tenant / location / group / global — lives in Chapter 8.7; this tab does not own whitelist entries.

Top-level configuration:
Enabled— master switch for this policy.Auto-whitelist (agent automatically adds connected USB devices to whitelist)withAuto-whitelist untildate — during this window the agent records every connected device into the whitelist; after the date passes, only the collected list is enforced.
Actions on unknown device. What the agent does when a USB device that does not match an approved whitelist entry is plugged in:
Eject / disable deviceLog device event
Device Type Filters. Which classes of USB device this policy monitors. Each class has two toggles — the class itself, and an Include Instance ID toggle that switches to strict matching (specific port / instance) rather than vendor / product matching:
| Class | Notes |
|---|---|
Mouse | Pointing devices. |
Keyboard | Keyboards. |
HID Class | Other Human Interface Devices. |
USB | Generic USB devices not in the more specific classes. |
Disk Drive | Mass-storage USB drives. |
WPD (Portable Devices) | Phones, cameras, MTP devices. |
CD-ROM | Optical drives. |
Media | Streaming-class devices. |
Network Adapter | USB Ethernet / Wi-Fi dongles. |
Xbox Composite | Game controllers. |
Other Settings.
Periodic check interval (minutes)— agent recheck cadence (1–1440).Tray icon notifications— show the on-device user a notification when a device is blocked. When enabled, setNotification titleandNotification message. The message supports the placeholders{device_name},{device_type},{actions}, and{count}.
Blocked devices land on the Blocked Devices tab in Collections, where an admin can approve them at one of five whitelist scope levels (device, tenant, location, group, or global). See Chapter 8.7 for the scope model and approval flow.
6.9 Linux tab — UFW firewall
The Linux tab currently covers one Linux-only feature: UFW, the Uncomplicated Firewall.

The UFW section has two master toggles, a default-policy block, and two separate rule tables.
Master toggles:
Enabled— enables UFW management by this policy.UFW active on device— sets UFW's own active/inactive state on devices under this policy.
Default Policies:
Default incoming—Deny,Allow, orReject.Default outgoing—Allow,Deny, orReject.
Simple Rules. Inline table for common port-based rules:
| Column | What it holds |
|---|---|
Action | Allow / Deny / Reject |
Port | A single port, a range, or a comma-separated list |
Protocol | TCP / UDP / Any |
Comment | Free text |
An Add Rule button above the table creates a new row. Editing is inline — there is no separate dialog.
Advanced Rules. Inline table for rules that need source / destination specifics:
| Column | What it holds |
|---|---|
Action | Allow / Deny / Reject |
Direction | In / Out |
Protocol | TCP / UDP / Any |
Source IP | for example 10.0.0.0/8 |
Source Port | A single port |
Dest IP | Destination address or any |
Dest Port | A single port |
Comment | Free text |
Same Add Rule and inline-editing pattern as Simple Rules.
Enforcement model. On every sync cycle the agent rebuilds UFW from the rules defined here — any existing rule not in this policy is removed. The agent also monitors UFW for external changes and re-applies the policy rules on the next check (tamper protection). Two outbound safety rules for NetLock RMM communication and remote-control endpoints are always injected automatically, so a misconfigured ruleset cannot lock the agent out.
Caution: Enabling UFW with
Default incoming = Denyand no matching simple rule will block every inbound connection except the agent's own safety paths. Build the ruleset first, then flipUFW active on deviceon.
Note: UFW must be installed on the target device (
apt install ufw). Distributions that do not ship UFW are silently skipped by the agent.
Settings here have no effect on Windows or macOS devices.
6.10 Sensors tab
The Sensors tab attaches sensors from the Sensors library to the policy. Sensor mechanics — the nine sensor categories, severity levels, notification and action thresholds, and action-script hooks — are documented in Chapter 8.3.

Within this tab you pick from sensors already defined in Collections and toggle them on for the policy. Devices assigned the policy run the selected sensors on their schedule, evaluate thresholds on the agent, and report readings back to the Console for dashboards, events, and action-script execution. Sensor-specific configuration (category, thresholds, action script) lives in the sensor definition itself, not here.
6.11 Jobs tab
The Jobs tab attaches jobs from the Jobs library to the policy. Job mechanics — the twelve schedule types, hidden jobs, and the Script reference — are documented in Chapter 8.2.

You pick jobs that should run on devices under this policy. Each job carries its own schedule from the job definition; the policy is the attachment point that decides which devices receive which jobs. Jobs flagged hidden do not appear in the Events view and are typically used to collect data that populates Custom Fields — see Chapter 8.4.
6.12 Patch Management tab
The Patch Management tab is where you configure how a policy's devices actually install approved patches. It complements the global approval queue in Chapter 7 — Chapter 7 answers "which patches may be installed at all?", this tab answers "when and how do these specific devices install the approved patches?".

The tab is laid out as five sub-tabs — Global, Windows, Linux, macOS, Docker. Global carries cross-platform defaults; the four platform sub-tabs configure their respective rollout behaviour and do not inherit from each other.
Global sub-tab
Defaults applied across all four platforms:
Check minimum free disk space before patching— if on, skip devices below the threshold.Minimum free disk space (%)— numeric, 1–50.Catch up missed patches (install if device was offline during scheduled window)— install missed patches when the device comes back online.Metered connection behavior—Block patching on metered/cellular connectionsorAllow patching on metered/cellular connections.Automatic patch rollback (defer update if failure rate exceeds threshold)— pause rollout if too many devices fail a patch.Failure threshold (%)— numeric, 1–100.
The patch-management mode (Disabled / Informational / Managed) is not in the Global sub-tab; it is set per platform under that platform's General sub-tab.
Platform sub-tabs
The four platform sub-tabs do not share a uniform sub-tab structure:
| Platform | Sub-tabs |
|---|---|
Windows | General, Approval & Filtering, Deployment Rings, Schedule, Reboot, Notifications, Retry |
Linux | General, Approval & Filtering, Deployment Rings, Schedule, Reboot, Retry |
macOS | General, Approval & Filtering, Deployment Rings, Schedule, Reboot, Retry |
Docker | General, Behavior, Schedule, Registries |
The common Windows / Linux / macOS sub-tabs configure:
-
General. Sets the patch-management mode for this platform:
Disabled— the agent does nothing.Informational— the agent reports available patches but does not install them.Managed— the agent installs patches per this policy's rules.
Plus per-platform source toggles: Windows exposes
Install OS patches (Windows Update),Install application patches (Winget),Install application patches (Chocolatey), and aDisable Windows built-in automatic updates (take control via NetLock RMM)switch (forced on inManagedmode). Linux exposesInstall OS packages (apt/dnf/yum). macOS exposes its own OS-source toggles. -
Approval & Filtering.
- Approval Gate —
Only install patches that have been approved in Patch Management. When on, onlyApprovedpatches install;Pending,Rejected, andDeferredare skipped. This is the bridge to Chapter 7. - Allowed Severities — explicit checkboxes for
Critical,High,Medium,Low,Unspecified,Informational. - Allowed Update Types (Windows) —
Security,Regular,Definition,Rollup,Service Pack,Feature,Driver,Other. Linux and macOS expose aPreferred Update Sourceselector (Auto-detect / APT / DNF / YUM on Linux; equivalent on macOS) instead.
- Approval Gate —
-
Deployment Rings. Per-severity scheduling. For each of
critical,high,medium,low,unspecified,informational, pick aRing Type:Immediate— install as soon as the patch is eligible.After N days— install N days after the patch becomes eligible (N from a paired numeric field).Patch Tuesday + N days— install N days after the most recent second-Tuesday Microsoft release.First weekend after Patch Tuesday.Second weekend after Patch Tuesday.
Rings are per-severity within one policy, not per-device cohort.
-
Schedule.
Allowed patch days— seven day-of-week checkboxes.Maintenance window—FromandTotimes (set them equal for a 24/7 window).- Smart Maintenance Window —
Enable smart maintenance window (auto-detect ideal patch time). When on, optional sub-conditions:Require user idle+Idle duration (minutes)(15–480),Require AC power (for laptops),No active RDP sessions.
-
Reboot.
Reboot behavior after patch installationwith three values:Automatic reboot— reboot without prompting.Ask user (with maximum deferral)— prompt the user;Maximum deferral (hours)(1–168) caps the delay.Do not reboot— leave reboot to the user / next maintenance cycle.
Plus
Install all pending patches before rebootingandNotify user via Tray Icon when reboot is required. This is the only place reboot policy is configured — Chapter 7 does not surface reboot controls. -
Notifications (Windows only). End-user tray notifications during patch operations — these are not the deployment-wide notification channels in A.8 Notifications deep dive. Toggles include
Notify user when updates are being installedwithInstalling — title/Installing — messagetext,Show update category to end user,Show individual update names, per-category suppression checkboxes (Security, Regular, Definition, Rollup, Feature, Driver, Service Pack, Other, Application (Winget)),Reboot required — message, and a pre-warning block (Show pre-warning notification before updates start+ minutes-before-start + message template with a{time}placeholder). -
Retry.
Retry count for failed patches(0–10) andRetry delay (minutes)(10–1440).
The Docker sub-tab is structured differently:
- General. Docker mode and platform-level options.
- Behavior. Docker-specific install behaviour.
- Schedule. Maintenance window equivalent.
- Registries. Registry credentials and per-registry preferences.
Note: The per-platform structure lets you run a tight maintenance window on Windows servers and a looser one on Linux workstations from the same policy. There is no implicit inheritance between platforms — Linux patching uses the Linux platform's sub-tabs regardless of what Windows is configured to do.
Every sub-tab is self-contained; you do not have to fill in all of them before a policy is usable. A minimal patch configuration is often just General (mode = Managed, source toggles) plus Schedule (a maintenance window).
6.13 App Hub tab
The App Hub tab curates which apps from the global App Hub catalogue are visible in the tray icon for devices under this policy.

For each app in the catalogue you can toggle:
- Whether the app appears in the tray window for devices under this policy.
- Whether the agent auto-updates the app when a new version is available in the catalogue.
This tab is a catalogue curation — it decides what the end user sees in the tray. It does not deploy apps. Deployment happens through Software Deployment in Chapter 8.8, which is independent of any policy.
The App Hub catalogue itself (manual app entries, catalogue browsers for Winget / Flathub / Chocolatey, Refresh catalogs sync) lives in Chapter 8.5.
6.14 Applying a policy
The short answer to "how do I apply this policy to a device, group, or tenant?" is: you don't, directly.
Policies are routed to devices exclusively through Automations. To put this policy on a device you:
- Identify an attribute of the device that should trigger this policy — device name, tenant, location, group, internal or external IP, or domain.
- Create an automation whose condition matches that attribute and whose target is this policy.
- Adjust the rule's priority so it takes precedence over any other matching rules.
That is the entire procedure. There is no "Apply Policy" button on the Policies page. There is no "Attach to group" affordance on the Groups page. There is no "Set policy" action on the Devices page. See Chapter 5 for the routing layer and a worked example.
Tip: If you like to see what policy is being applied to what device, open the device overview. There is a column called policy that displays the current assigned policy.".
Permissions
Policies are gated by five permission flags:
policies_enabled— master flag. A user without this flag does not see thePoliciesnavigation entry and cannot reach/policiesor/policy_settings.policies_add— create a new policy from theManage Policiespage.policies_manage— clickManageon a policy row to openPolicy Settingsfor editing.policies_edit— save changes in thePolicy Settingseditor.policies_delete— delete a policy.
Permissions for features that live inside a policy (Antivirus, Application Control, Device Control, Patch Management, Sensors, Jobs, App Hub) are covered in their own Collections sections — see Chapter 8 — and in Chapter 14.
Related chapters
- Core Concepts — the one-policy-per-device rule in context.
- Chapter 4 — Tenants, Locations & Groups — the attributes policies are routed against.
- Chapter 5 — Automations — the only way to assign a policy to a device.
- Chapter 7 — Patch Management — the global approval queue that the per-policy rollout rules draw from.
- Chapter 8 — Collections — Scripts, Jobs, Sensors, Custom Fields, App Hub, Application Control, Device Control, Software Deployment.
- A.7 Remote screen control — deployment-wide remote-control defaults.
- A.8 Notifications deep dive — channels and recipients for Antivirus, Patch, and other notifications emitted by policy rules.
Patch Management
The Patch Management page is the Console's view of the fleet-wide patching pipeline. It answers two questions: which patches are approved to install anywhere in the estate? and what is my compliance posture against the patches that exist?. It deliberately does not answer "when does a specific policy's devices actually reboot?" — that configuration lives inside a policy.

7.1 Scope — this page versus the policy editor
Patch Management in NetLock RMM is split across two places on purpose:
- The
Patch Managementpage at/patch-management— the subject of this chapter — is global. It shows every patch the system knows about, holds the approval state for each, tracks compliance against SLA thresholds, displays known vulnerabilities, and configures deployment-wide patch defaults. It is a queue and an observatory, not a scheduler. - The
Policy Settings → Patch Managementtab — documented in Chapter 6.12 — is per-policy. It decides when and how the devices assigned to a given policy actually install the patches that have been approved on this page. That is where the per-platform rollout rules, deployment rings, maintenance windows, reboot behaviour, notifications, and retry configuration live.
Both chapters cross-link. Do not expect to find rollout scheduling or reboot controls on the page covered here.
7.2 The four tabs
Patch Management is a single page with four tabs across the top:
| Tab | Purpose |
|---|---|
Update Approval | The main queue — every known patch with its approval state, compliance counts, and SLA status. |
Vulnerabilities | Known CVEs affecting devices in the fleet, loaded from the NVD database. |
Update History | A history view of update installs, successes, and failures. |
Settings | SLA thresholds, vulnerability scan interval, NVD download settings, history cleanup. |

Actions in this chapter all happen inline — there are no standalone dialog windows on this page. Row menus and toolbar buttons take you through the workflows directly.
7.3 The approval workflow
Every patch in the Update Approval tab is in one of four states:
Pending— newly discovered; no admin decision yet.Approved— eligible for installation anywhere the policy-level rules allow it.Rejected— explicitly blocked fleet-wide; no device will install it.Deferred— postponed. The default defer period is 7 days; after the timer expires the patch returns toPending.
From the table toolbar you can act on one or many selected rows. Available actions:
- Approve — set state to Approved.
- Reject — set state to Rejected. A confirmation is shown ("Are you sure?") because rejection is a fleet-wide block.
- Defer — postpone for N days (default 7).
- Reset to Pending — revert from any other state.

Every state change triggers an immediate re-sync of every device. Devices do not wait for their next scheduled poll — the updated approval set lands on every agent as soon as the server can deliver it.
Important: Approval on this page is global. There is no per-device, per-group, per-location, or per-tenant approval on the
Patch Managementpage. Narrowing a patch's rollout to a subset of the fleet is done with theApproval & FilteringandDeployment Ringssub-tabs inside a policy (see Chapter 6.12).
7.4 The compliance model
Each row in the Update Approval tab carries three compliance indicators in addition to its approval state:
Installed— count of devices that already have the patch installed.Pending— count of devices where the patch is available but not yet installed.SLA Status— one ofCompliant,At Risk,Overdue.
SLA status is computed per row based on the patch's severity and how long it has been known. The threshold for each severity is the number of days after first discovery within which a device is expected to have installed the patch:
| Severity | Default days | Setting key |
|---|---|---|
| Critical | 7 | patch_sla_critical_days |
| High | 15 | patch_sla_high_days |
| Moderate | 30 | patch_sla_moderate_days |
| Other / Low / Unspecified | 60 | patch_sla_other_days |
SLA state transitions:
Compliant— within SLA. The deadline has not passed.At Risk— three days or fewer to the deadline.Overdue— the deadline has passed on at least one device.
Change the thresholds on the Settings tab if your environment operates to a different cadence.
7.5 The Vulnerabilities tab (cooming soon)
The Vulnerabilities tab shows known CVEs that affect devices in your fleet. Data comes from two sources:
- The National Vulnerability Database (NVD) — the authoritative public feed of CVE records.
- The Console's own device inventory, which pairs each device's installed software with the CVE records that reference those products.
The tab is a cross-reference of the two: rows represent CVEs affecting devices you manage, with counts of how many devices are exposed and links through to those devices.

NVD data is refreshed on an interval controlled by the nvd_auto_download_enabled flag on the Settings tab. When the toggle is on, the server downloads NVD feeds automatically; when it is off, the existing data is still available but is not refreshed until you turn the toggle back on.
7.6 The Settings tab
The Settings tab holds the page's configuration knobs. These are deployment-wide — they affect the whole Patch Management page, not a particular policy.

| Setting | Default | Meaning |
|---|---|---|
patch_sla_critical_days | 7 | SLA threshold for Critical-severity patches. |
patch_sla_high_days | 15 | SLA threshold for High-severity patches. |
patch_sla_moderate_days | 30 | SLA threshold for Moderate-severity patches. |
patch_sla_other_days | 60 | SLA threshold for remaining severities. |
vulnerability_scan_interval_hours | — | How often the server re-evaluates device inventory against the CVE set. |
nvd_auto_download_enabled | — | Whether NVD feeds are downloaded automatically. |
cleanup_update_history_enabled | — | Whether update history entries are periodically cleaned up. |
Changes to SLA thresholds apply immediately; the next render of the Update Approval tab uses the new values to compute SLA status.
7.7 Platforms and sources
The Update Approval tab filters by platform and by source. The platform dropdown supports:
WindowsLinuxMacOSDocker
The source dropdown supports:
| Source | Platform | Notes |
|---|---|---|
OS-Mandatory | Windows, macOS | Native OS-provided updates. |
Winget | Windows | Windows Package Manager updates. |
Chocolatey | Windows | Chocolatey package updates. |
Apt | Linux | Debian / Ubuntu package updates. |
Dnf | Linux | Fedora / modern RHEL package updates. |
Yum | Linux | Older RHEL / CentOS package updates. |
Docker | Docker | Container image updates. |
MacOS | macOS | Native macOS updates. |
Approval is per patch regardless of source. An Approved patch from Winget installs under the same rules as an Approved patch from OS-Mandatory — the per-policy Approval & Filtering sub-tab is where you gate which sources a particular policy's devices accept.
7.8 What is not on this page
Several controls that admins from other RMMs look for on a "patch management" page live elsewhere in NetLock RMM. Knowing where to find them saves time.
- Per-device or per-group exclusion lists. Not here. A patch is Rejected fleet-wide or not at all. If you need to exclude a subset, use the
Approval & Filteringsub-tab inside the relevant policy (Chapter 6.12) — or split those devices into a different policy with stricter filters. - Rollout scheduling — maintenance windows, allowed days, time ranges. Not here. Configure them on the
Schedulesub-tab inside a policy's Patch Management tab. - Deployment rings. Not here. Configure them on the
Deployment Ringssub-tab inside a policy's Patch Management tab. - Reboot behaviour and user prompts. Not here. Configure them on the
Rebootsub-tab inside a policy's Patch Management tab. - Retry on failure. Not here. Configure it on the
Retrysub-tab inside a policy's Patch Management tab. - Notifications. Not configured here. Per-event patch notifications are toggled on the
Notificationssub-tab inside a policy's Patch Management tab; the channels and recipients those notifications are sent through live in A.8 Notifications deep dive.
The split is deliberate: one global decision ("may this patch install anywhere?") and many per-policy decisions ("how do these particular devices install the things that are allowed?").
Permissions
Patch Management is gated by a single permission flag in the current release:
patch_management_enabled— master flag. Users without this flag do not see thePatch Managementnavigation entry and cannot reach/patch-management.
There is no finer-grained approve / reject / defer / view-only permission. A user who has the flag can perform every action on the page.
Related chapters
- Chapter 6 — Policies — the per-policy Patch Management tab, where rollout rules live.
- Chapter 6.12 — direct link to the per-policy Patch Management sub-tab reference.
- Chapter 12 — Events & Audit — event records for patch installs and approval changes.
- A.8 Notifications deep dive — channels and recipients for patch notifications.
- A.2 Updates & maintenance — Console and server update cadence, distinct from endpoint patching.
Collections
Collections is the umbrella menu group for eight reusable libraries that feed the rest of the product. Scripts, Jobs, Sensors, and Custom Fields are the programmable building blocks — small units you assemble into larger behaviours. App Hub, Application Control, and Device Control are catalogues — curated lists of packages, application rules, and USB devices. Software Deployment is an execution engine that stitches App Hub entries into ad-hoc rollouts.

8.0 How Collections relates to Policies
Five of the eight Collections sub-sections are also referenced from inside Policy Settings. That pairing is consistent: this chapter documents the library — how you author and manage the building blocks — while Chapter 6 documents attachment — how a policy picks from the library and which devices end up running or enforcing the result.
| Collections subsection | Related policy tab |
|---|---|
| Jobs | Jobs tab — Chapter 6.11 |
| Sensors | Sensors tab — Chapter 6.10 |
| App Hub | App Hub tab — Chapter 6.13 |
| Application Control | Windows → Application Control — Chapter 6.7 |
| Device Control | Windows → USB Device Control — Chapter 6.8 |
Scripts, Custom Fields, and Software Deployment have no policy-tab counterpart — they are either called from inside another Collections feature (Scripts by Jobs and Sensors) or stand alone (Custom Fields, Software Deployment).
8.1 Scripts
Manage Scripts at /manage_scripts is the library of code snippets that Jobs, Sensors, and Custom Fields draw on.

The list columns: Name, Description, Platform, Shell, Author, Date.
Create and edit a script
Two dialogs handle the lifecycle — Add Script for a new script and Edit Script for an existing one. Both share the same field set:
Name— required.Description— free text.Default timeout— the script's default wall-clock timeout, in minutes (1 to 9999). The agent terminates the script if the timeout expires.Platform— one ofWindows,Linux,MacOS, orSystem.Shell— gated on Platform.
Platform and Shell pair up exactly as follows; other combinations are not supported:
| Platform | Allowed Shells |
|---|---|
Windows | PowerShell, Python3 |
Linux | Bash, Python3 |
MacOS | Zsh, Python3 |
System | MySQL |
The System platform runs server-side database operations — typically used by SQL-backed Custom Fields and certain reporting workflows — not endpoint scripts.
The editor
The body of each dialog is a Monaco code editor with language-specific syntax highlighting driven by the selected shell. Two helpers sit next to the editor:
Templatesdropdown — starter examples for the current shell. Picking a template replaces the editor contents.AI Assistant— shown only when AI is enabled inSettings → AI/LLM. Opens a chat panel that can draft or refactor the script in place.
Community Scripts
The Scripts library has a community-sharing surface. Five dialogs cover it:
- Community Scripts browser — lists scripts published to the community repository. Filter by platform, shell, or keyword; preview the source; click
Importto copy a script into your library. - Import from GitHub — imports directly from a GitHub URL when the script is not in the community repository.
- Publish — pushes one of your own scripts to the community repository. Requires community permissions and the script must have a description.
- Report — reports a community script as abusive or incorrect.
- View — detailed metadata view for a community script before import.
Imports land as standard entries in your Scripts library — they are regular scripts from that moment on, editable like any other.
Tip: Set
Default timeoutconservatively. A runaway script that never terminates ties up an agent until it hits the limit; a five-minute default is safer than the maximum.
How Scripts are used
- Jobs pick a Script as the thing to execute on a schedule. See 8.2.
- Sensors reference a Script in two ways — as the monitoring source for the PowerShell / Python3 / Bash / Zsh categories, and as the action script to run when thresholds are breached. See 8.3.
- Custom Fields reference a Script indirectly, via the Job whose output the field parses. See 8.4.
Scripts are not called from Automations (Automations only assign policies — see Chapter 5) and are not used by Software Deployment (deployment jobs execute install scripts stored on the App Hub entry, not library Scripts).
Permissions (Scripts)
collections_enabled— master Collections flag.collections_scripts_enabled— see the Scripts page.collections_scripts_add— create a script.collections_scripts_edit— edit an existing script.collections_scripts_delete— delete a script.
8.2 Jobs
Manage Jobs at /manage_jobs is the library of scheduled tasks. A Job wraps a Script with a schedule and a platform. The Script is the "what"; the Job is the "when".

List columns: Name, Description, Platform, Type, Author, Date, and a hidden-status icon column (shown only on hidden jobs, with tooltip "Hidden — not shown in Events").
Create and edit a job
The Add Job and Edit Job dialogs share these fields:
Name,Description.Timeout— 1 to 9999 minutes. Independent of the underlying Script's default timeout; the Job's value wins.Schedule— dropdown of 12 options (see below).Platform—Windows,Linux, orMacOS.Type—PowerShell,Bash,Zsh, orPython3; the dropdown is filtered to what the selected Platform supports.Script— the Script to execute, populated from matching scripts in your library.Hidden— toggle. Hidden jobs do not appear in the Events view. The standard use case is a background collection job that feeds a Custom Field — you do not want it cluttering operational events.
The twelve schedule types
Jobs support twelve scheduling patterns. The same set is used by Sensors (see 8.3). Each is an entry in the Schedule dropdown:
System Boot— runs once per device on boot.Date/Time— one-shot execution at a specific date and time.Every X seconds— recurring interval in seconds.Every X minutes— recurring interval in minutes.Every X hours— recurring interval in hours.Starting on Date, every X seconds— seconds-recurring interval that begins at a specified date.Starting on Date, every X minutes— minutes-recurring interval that begins at a specified date.Starting on Date, every X hours— hours-recurring interval that begins at a specified date.On specific days at time— a single time plus Monday-through-Sunday checkboxes, so the job runs at the chosen time on each enabled weekday.On specific days every X seconds— seconds-recurring on selected weekdays only.On specific days every X minutes— minutes-recurring on selected weekdays only.On specific days every X hours— hours-recurring on selected weekdays only.
Intervals in seconds exist for tight monitoring-style jobs; day-limited intervals are the usual choice for maintenance tasks that should only run during business hours.
Jobs vs Scripts
A Script is a reusable piece of code. A Job is a scheduling wrapper that picks a Script. You can point many Jobs at the same Script with different schedules — for example a "hourly quick disk check" and a "daily deep disk audit" both running the same underlying script with different timeouts and cadences.
Attachment
Jobs attach to policies via the Jobs tab of Policy Settings — see Chapter 6.11. A job with no policy attachment exists in the library but does not run anywhere.
Permissions (Jobs)
collections_enabled,collections_jobs_enabled,collections_jobs_add,collections_jobs_edit,collections_jobs_delete.
8.3 Sensors
Manage Sensors at /manage_sensors is the library of monitoring sensors. A Sensor samples a metric on a schedule, evaluates thresholds, and optionally runs an action Script when the breach is severe.

List columns: Name, Description, Platform, Category, Sub-Category, Severity, Author, Date.
Severity takes one of four values: Critical, High, Moderate, Low. Severity is assigned at the sensor and is the label surfaced on notifications and on the Dashboard.
Create and edit a sensor
The Add Sensor and Edit Sensor dialogs share the core fields — Name, Description, Platform, Severity, Schedule (the same twelve options Jobs use), Category. The dialog then renders a conditional Sub-Category and Rule block based on the chosen category.
The nine categories
Sensors come in nine categories:
-
Utilization — host-level metrics. Six sub-categories:
Processor— CPU usage threshold.RAM— memory usage threshold.Drive— disk space or IO threshold.Process CPU Usage (%)— CPU percentage consumed by a named process.Process RAM Usage (%)— memory percentage consumed by a named process.Process RAM Usage (MB)— memory bytes consumed by a named process.
Rule configuration uses a threshold slider (5 to 100 percent, step 5) for the Processor / RAM / Drive variants, and a
Process Namefield plus aNotification Threshold Maxvalue (0 to 9999) for the Process-CPU / Process-RAM variants. -
Windows Eventlog — match entries in the Windows event log against a query. Useful for specific event IDs that represent failures you care about.
-
PowerShell — the data source is a PowerShell script. The agent runs the script on schedule; the script's numeric output is the sample value.
-
Python3 — same model, Python3 as the language.
-
Bash — same model, Bash as the language.
-
Zsh — same model, Zsh as the language.
-
Service — the state of a Windows or Linux service. Breaches when the service is not in the expected state.
-
Ping — ICMP reachability of a host. Breaches on loss.
-
SNMP — SNMP GET, Walk, or Monitor operation against a network device. The sensor stores credentials and queries per-sensor.
Thresholds and actions
Every sensor defines two threshold levels:
Notification Threshold Max— when the sampled value exceeds this, a notification is generated.Action Threshold Max— when the sampled value exceeds this, the configured action Script runs in addition to the notification.
The action section exposes a Script dropdown, populated from Scripts that match the sensor's Platform and runtime. When the sensor breaches the action threshold, the agent executes the selected script on the device that reported the breach. This is the canonical pattern for "when disk hits 95%, run the cleanup script".

Sensor readings are one of the Dashboard's queryable data sources (see Chapter 2), and sensor breaches appear in Events (see Chapter 12).
Attachment
Sensors attach to policies via the Sensors tab of Policy Settings — see Chapter 6.10.
Permissions (Sensors)
collections_enabled,collections_sensors_enabled,collections_sensors_add,collections_sensors_edit,collections_sensors_delete.
8.4 Custom Fields
Manage Custom Fields at /manage_custom_fields is the library of Custom Field definitions. Unlike a traditional RMM that exposes a handful of text inputs as "custom fields", NetLock RMM's Custom Fields compose entire tabs and sections of the device detail page, populated from multiple data sources.

List columns: Name, Description, Author, Date, Tabs (count of tabs this definition contributes).
The builder dialog
A single dialog — the Custom Field Builder — handles both Add and Edit. The builder is a multi-panel visual editor, not a simple form; it designs an entire device-detail-page fragment in one place.

The builder has the following structure.
Definition panel (top). Name and Description of the Custom Field set.
Header Action Buttons. A list of buttons injected into the device detail header next to the standard controls (Screen Control, Shell, and so on). Each button has:
Label— what the button says.Type—URL HandlerorSQL Execute.Icon— autocomplete over the icon set.
URL Handler buttons open a URL template. The template supports placeholder tokens {device_id} and {field_key}, which are substituted at click time. SQL Execute buttons run a SQL statement on the server; the statement supports the {device_id} placeholder and has a Require confirmation checkbox for destructive actions.
Tabs. The top-level containers on the device detail page that this definition contributes to. Each tab has:
Target—New Tab,Existing Tab, orExisting Section.New Tabcreates a fresh tab; the other two inject into a tab or section that already exists elsewhere in the detail page.Tab NameandIcon— shown forNew Tab.
Sections. Inside each tab, one or more sections — each with a Section Name — appear as labelled blocks on the device page.
Fields. Inside each section, one or more fields. Every field has:
Key— the programmatic identifier used in placeholders.Label— the human-readable name.Type— one ofText,Multiline, orTable.Data Source— one ofManual,Job Result, orSQL Select.
Data sources in detail:
Manual— the field is free for users to edit on the device detail page. The value is stored per device.Job Result— the value is auto-populated from a Job's output. The builder asks for aJob Name; if you need to pluck part of the output, supply aParse Regex. Jobs used to feed Custom Fields are typically flaggedHiddento keep them out of the Events view (see 8.2).SQL Select— the value is the result of a SQL query. Two modes:- Visual Query Builder — pick a table, pick columns (with aggregates
COUNT,SUM,AVG,MIN,MAX,DISTINCT), add joins (INNER,LEFT,RIGHT), add WHERE filters withdevice_idalready available as a placeholder, setORDER BYandLIMIT. - Raw SQL — gated by a "God Mode" toggle. Lets you enter SQL directly, with
{device_id}as the available placeholder.
- Visual Query Builder — pick a table, pick columns (with aggregates
Section Action Buttons. Each section can carry its own buttons, with the same shape as Header Action Buttons but scoped to the section. Useful when an action is only meaningful in the context of the data shown in that section.
Scope
Values are per-device. Every device that lands under a Custom Field definition has its own value set. The field metadata (keys, labels, types, queries) is shared; only the values are per-device.
Consumption
- The device detail page renders every tab, section, and field a Custom Field Definition declares — see Chapter 3.
- Dashboard panels can query the same underlying storage via the Panel Builder's SQL query builder, which lets you aggregate custom-field data across the fleet.
- Reports do not expose custom-field values as a selectable data source in the Report Builder. Custom fields appear in Reports only as optional key-value entries on the cover-page footer of a brand template — a cosmetic integration, not a queryable one. To include custom-field data in a report, write a raw SQL query against the underlying storage in God Mode, if your role has it.
Permissions (Custom Fields)
collections_enabled,collections_custom_fields_enabled,collections_custom_fields_add,collections_custom_fields_edit,collections_custom_fields_delete.
8.5 App Hub
Manage Apps at /app_hub_manage_apps is the catalogue — the library of installable packages the product knows about. The App Hub is explicitly not a deployment engine. Deploying one of these apps to devices happens through Software Deployment (see 8.8); this page is where the list of available apps is maintained.

List columns: Icon, Name, Publisher, Version, Source (colour-coded chip: winget, flatpak, chocolatey, script), Target OS, and per-row Edit and Delete actions. Only one tab — "Apps" — is visible.
The three sources plus manual entries
Four catalogues feed the page:
- Winget — Windows Package Manager feeds, used for Windows apps.
- Flathub — the Flatpak catalogue, used for Linux apps.
- Chocolatey — Chocolatey feeds, used for Windows apps.
- Script — manual entries backed by install / update / uninstall / detection scripts you write.
Adding an app — manual entry
The Add_Manual_App dialog creates a catalogue entry by hand. Fields common to all sources:
Name(required),Description,Version,Publisher,Author,License,Homepage,Target OS, and an icon upload.
Source-specific fields appear based on the source picker:
Winget—Winget Package ID,Winget Source.Chocolatey—Chocolatey Package ID,Chocolatey Source.Flatpak—Flatpak App ID.Script—Install script,Update script,Uninstall script,Detection script, and aScript Shellselector.
The Edit_App dialog presents the same fields pre-populated against an existing entry.
The Detection script is optional and governs whether a deployment install is skipped. It runs on the device before every install (never for update or uninstall), in the same shell as the install script, in the agent's context (SYSTEM/root) with a 5-minute timeout. Exit code 0 plus at least one line of output means the app is already installed — the install is skipped and the device is reported as Skipped (a success). Any other result (non-zero exit code, or exit 0 with no output) runs the install. A detection crash or timeout is treated as "not installed" and the install proceeds (fail-open). Force reinstall on a deployment bypasses detection entirely. See Deploy custom applications with scripts for a full walkthrough.
Adding an app — catalogue browsers
For Winget, Flathub, and Chocolatey there are dedicated browser dialogs — Winget_Catalog_Browser, Flathub_Catalog_Browser, and Chocolatey_Catalog_Browser. Each is a searchable table of the remote catalogue with a metadata preview pane. Select a row, click Add to Catalog, and the app is copied into your local App Hub with its identifiers pre-filled.

Refreshing the catalogues
The page has a Refresh catalogs button that triggers an asynchronous sync of all three remote catalogues. Progress is shown in the page's status area; the button reports when the sync completes. Refreshing updates the versions and metadata of apps already in your catalogue and lets newly browsed apps pick up the latest remote data.
The available_for_deployment flag
Every app entry has an available_for_deployment flag. Apps with this flag set are selectable inside the Software Deployment wizard (see 8.8). Apps without it are visible in the catalogue and in the policy-level App Hub tab, but cannot be picked as deployment targets.
How policies use App Hub
The App Hub tab inside Policy Settings (see Chapter 6.13) decides which catalogue apps are visible to end users in the tray icon under a given policy. This is catalogue curation, not deployment. Selecting apps in the policy does not install anything — it decides what the tray exposes.
Permissions (App Hub)
collections_app_hub_enabled— see the App Hub page.collections_app_hub_add— add a manual app.collections_app_hub_browse_winget,collections_app_hub_browse_flathub,collections_app_hub_browse_chocolatey— use the respective catalogue browsers.collections_app_hub_manage— edit, delete, and refresh catalogues.
8.6 Application Control
Application Control is an allowlist system for executables on Windows devices. Rulesets live at /application_control_manage_rulesets. The ruleset detail page is at /application_control_ruleset.

The page has two tabs.
Rulesets tab
List columns: Name, Description, Author, Date.
Actions:
- Add Ruleset — create a ruleset (
Name,Description). - Edit Ruleset — rename or redescribe.
- Delete Ruleset — delete.
Click a ruleset to open its detail page, which lists the rules inside it. The detail page has Back, Save, Edit, and Delete affordances at the top and Add, Edit, Delete actions on the rule list.
Rules inside a ruleset
Each rule identifies one allowed executable by any combination of file and certificate attributes. The Add Rule and Edit Rule dialogs share these fields (Name is required; everything else is optional and combines with AND semantics when present):
File attributes:
File Path— absolute or pattern path to the executable.File Company,File Product,File Copyright,File Brand— Windows version-info strings.File Product Version,File Version— Windows version-info numeric strings.File SHA256,File SHA512— cryptographic hashes of the executable.
Certificate attributes (for signed executables):
Certificate Owner,Certificate Issuer.Certificate Begin,Certificate End— validity window.Certificate Public Key,Certificate Serial Key.Certificate SHA1.
A rule matches when every specified attribute matches the running executable. Any executable not matched by any rule in a ruleset attached to a device is blocked.
Tip: A SHA256 or SHA512 hash rule is the strongest form and does not need other fields. Path-only rules are the weakest — any file at that path matches, regardless of its contents.
Blocked Applications tab
When the agent blocks a launch attempt, the attempt is logged and surfaces on the Blocked Applications tab. List columns: Policy (the ruleset name), Count (instance count for this blocked entry), Date, Device, Process, Path, Company, Product.
From this tab you operate on selections with two actions:
- Approve Selected — inserts the blocked entries as allowed rules into the associated ruleset. The server deduplicates by SHA512 so repeat approvals do not clutter the ruleset.
- Delete Selected — removes the log entries without whitelisting.
Every entry carries a status: Pending approval, Approved, or Dismissed. Approving moves an entry to Approved and adds a rule; dismissing moves it to Dismissed without adding a rule.
Attachment
Application Control rulesets attach to devices via the Windows → Application Control sub-section of Policy Settings — see Chapter 6.7. A ruleset with no policy attachment exists in the library but enforces nothing.
Permissions (Application Control)
collections_application_control_enabled— see the page.collections_application_control_add,collections_application_control_edit,collections_application_control_delete— ruleset-level lifecycle.collections_application_control_manage— manage rulesets broadly (Approve Selected and similar).collections_application_control_rules_add,collections_application_control_rules_edit,collections_application_control_rules_delete— rule-level edits inside a ruleset.
8.7 Device Control
USB Device Control is an allowlist system for removable peripherals. The same page is reachable from two routes — /device-control/whitelist and /device-control/blocked — each opening with a different tab selected.

Whitelist tab
List columns: Device Name, Manufacturer, Device ID (truncated with a tooltip showing the full ID), Scope chip (device, tenant, location, group, or global), Scope Target, Author, Date, Status (enable/disable toggle), and a per-row Delete action.
The Device ID encodes vendor-id, product-id, and serial number — the three pieces of information that uniquely identify a specific USB device (or a specific model, depending on how you later choose to scope the entry).
Blocked Devices tab
When the agent blocks a USB device, the event lands on the Blocked Devices tab.

List columns: Count, Date, Reporting Device, USB Device, Manufacturer, Type (device class: Mouse, Keyboard, HID, USB, DiskDrive, WPD, CDROM, Media, Network, XboxComposite), Device ID, Actions Taken, Status chip (Pending, Approved, Dismissed), and a context-menu actions column.
Approving a device (the only way to add a whitelist entry)
There is no standalone dialog for creating a whitelist entry. Entries are added exclusively by approving a pending row on the Blocked Devices tab. Click the row's menu icon and pick:
Approve for this device— the whitelist entry applies only to the specific device that reported the block.Approve for tenant— applies to every device in the tenant.Approve for location— applies to every device in the location.Approve for group— applies to every device in the group.Approve globally— applies to every device in the deployment.Dismiss— records that the block was reviewed but should not be whitelisted.
Approving at any of the five scopes inserts a row into the whitelist with the corresponding scope type and scope target. Dismissing closes the event without adding a whitelist row.
Matching granularity
A whitelist entry matches a USB device by vendor-id, product-id, and serial (encoded in Device ID), plus device class. Serial-level matching identifies one specific physical device; vendor-and-product-only matching accepts an entire model family. You choose this implicitly at approval time — the pending row carries the device's actual identifiers, and the resulting whitelist entry inherits them.
Attachment
USB Device Control is enabled per policy through the Windows → USB Device Control sub-section of Policy Settings — see Chapter 6.8. Approving an entry or toggling its status forces an immediate re-sync so endpoints pick up the change.
Permissions (Device Control)
collections_device_control_enabled— the sole permission gating the page in the current release. There are no separate add/edit/delete flags for USB Device Control.
8.8 Software Deployment
Software Deployment is the execution engine that drives App Hub packages onto devices. Three routes make up the feature:
Manage_Deploymentsat/software_deployment— the list of deployment jobs.New_Deploymentat/software_deployment/new— the four-step creation wizard.Deployment_Detailat/software_deployment/{id}— the detail view for a single deployment job.
Software Deployment is ad-hoc, not policy-driven. A deployment is created, run, and tracked as a discrete job; there is no tab in Policy Settings that composes deployments.
The deployment list

List columns: ID, Name, Author, Created, Mode (interactive or bulk), Status (pending, running, completed, completed_with_errors, cancelled), Progress (format succeeded/failed of target_count, with an error chip when failures exist), and Actions (View, Cancel, Retry, Rename, Clone, Delete).
The New Deployment wizard
The wizard has four steps.
Step 1 — Packages. Autocomplete-search the App Hub catalogue. Only apps flagged available_for_deployment = 1 are selectable. Each added package has an action dropdown — install, uninstall, or update. A single deployment may include multiple packages with mixed actions.

Step 2 — Targets. Choose the devices that should receive the deployment. You can add devices directly, or select groups, locations, or tenants; a dynamic-membership flag keeps a group target live as devices enter or leave the group.
Step 3 — Config. Per-deployment settings:
Mode—interactive(real-time feedback in the Console) orbulk(background).Schedule start time— when execution may begin.Expiry— when unstarted targets are abandoned.retry_max— maximum retry attempts per target on failure.retry_backoff_min— minimum minutes between retries.Force reinstall— reinstall even if detection shows the package already installed.Abort on first failure— stop the entire deployment when any target fails.
Step 4 — Review and Submit. A summary view of the chosen packages, targets, and configuration. Confirming creates the deployment. If Schedule start time is in the past or unset, the deployment begins running immediately.
The detail page

The detail view shows four info cards across the top — Status, Progress, Author & Created, Scheduled / Expires — followed by a per-device results table. Action buttons at the top of the page: Back, Cancel (available while status is pending or running), Retry (available when any target has failed), Rename, Clone, Delete.
Each row in the per-device table is a target device; its inner data is an attempt history surfaced through the per-device results dialog.
Per-device result detail
The per-device results dialog shows every attempt the deployment made on one device. Per attempt it displays:
Job Item ID,Attemptnumber.Outcome—success,failure, orSkippedchip.Skipped(blue) means the app's detection script reported it as already installed, so the install did not run; it counts as a success. Thestdout tailcarries a[detection]note explaining the skip.Exit code,Duration,StartedandFinishedtimestamps.Error summary— an alert block if the attempt raised a specific error.stdout tailandstderr tail— trimmed output from the install script.
This is the primary forensic view when a deployment has failures — exit codes and stderr tails tell you whether the failure is a package problem, a permissions problem, or a transient network issue.
Retry and the Retry button
The Retry button on the detail page re-queues every failed target in the deployment. Retries respect retry_max and retry_backoff_min from the original configuration and increment the attempt counter. Successful targets are not touched. This is the standard remediation workflow — fix whatever caused the failure, then press Retry.
Ad-hoc single-device deployment
The Deploy Software dialog is a compact single-device flavour of the wizard, launched from outside the main Software Deployment page (for example from a device detail view). It carries the selected device's identity along with a package autocomplete and an action dropdown. Run Now creates the job and starts it immediately without the full wizard.
Relationship to App Hub
App Hub is the catalogue of what can be installed; Software Deployment is how it gets installed. A deployment pulls metadata from App Hub (package identifiers per source, install / detection scripts, elevation requirement) and wraps it in a job with targets, scheduling, retry rules, and per-device tracking. The two features are intentionally separate.
Permissions (Software Deployment)
collections_software_deployment_enabled— see the Software Deployment pages.collections_software_deployment_view— view deployment lists and detail pages.collections_software_deployment_add— create a new deployment.collections_software_deployment_manage— cancel, retry, rename, clone, and delete deployments.
Related chapters
- Core Concepts — Collections as reusable building blocks.
- Chapter 5 — Automations — the policy routing layer; event-driven reactions live with Sensors, scheduled work with Jobs.
- Chapter 6 — Policies — attachment points for Jobs, Sensors, App Hub, Application Control, and Device Control.
- Chapter 7 — Patch Management — the approval queue for OS and package updates, separate from Software Deployment.
- Chapter 12 — Events & Audit — where script, job, sensor, and deployment outcomes surface.
- Chapter 13 — AI Chat — generating scripts for the Scripts library with AI assistance.
- Chapter 15 — Community — the community repository the Scripts library publishes to and imports from.
File Server & Monitoring
This chapter covers four independent features that share a menu group in the navigation. They are not part of Collections, and they are not tied to Policies. Each feature stands alone and is documented in its own section.
- File Server is a centralised storage hub for binaries, scripts, packages, and any other file you want agents or technicians to pull from a single known location.
- Relay Server lets you reach a device's TCP service (Remote Desktop, SSH, a web admin UI, a database port) through a relay tunnel when a direct connection to the device is not possible.
- Website Uptime Monitoring checks external URLs from the server on a schedule and raises events when availability, performance, SSL certificates, content, or DNS falls outside thresholds.
- Port Scanner sweeps a manually-curated list of targets for open TCP ports and surfaces findings against an allowlist.
9.1 File Server
Manage Files at /manage_files is the product's file distribution hub. Use it to publish anything your agents, scripts, or technicians need to download from a predictable place — installers, configuration bundles, intermediate artefacts a script produces on one device and another consumes, or simple documentation you want a tray-icon-initiated URL to resolve to.

List columns
The file list shows eight columns:
| Column | Meaning |
|---|---|
Name | File or folder name, prefixed with a file or folder icon. |
Type | folder or file. |
Size | Byte size for files; blank for folders. |
Modification Date | Timestamp of the last content change. |
Access | Public or Private toggle, shown on files only. |
GUID | Server-assigned identifier used in download URLs. |
Password | Per-file password, used to gate Private downloads. |
SHA512 | Content hash, used to verify integrity on the receiving side. |
Upload, download, and delete
Uploads go through the Upload File action in the page toolbar. The action opens the native file picker, then streams the selected file to the File Server with a progress indicator. A single upload can carry up to 10 GB. Larger artefacts must be split before upload.
Downloads are initiated from a file's context menu. The resulting URL embeds the file's GUID, and, for private files, its Password. Public files do not require a password in the URL.
Delete is also on the context menu. Deleting a folder removes its contents; there is no separate recursive-delete confirmation beyond the standard delete prompt.
Public versus private access
Every file has one of two access levels, toggled inline in the Access column:
Public— any holder of the download URL can retrieve the file. No password in the URL.Private— the download URL must include the file'sPassword. Without it, the server rejects the request.
Access is file-by-file. There is no directory-level ACL and no per-user ACL — any user who can reach the page can change a file's access level.
The /netlock folder
A folder named /netlock at the root is gated by a dedicated permission, file_server_netlock. Users without that permission see an empty view when they open it and cannot upload into it. Treat /netlock as the place for files you want kept out of the hands of technicians who otherwise have File Server access.
SHA512 integrity
Every file shows its SHA512 hash in the list. When a script or an agent downloads the file, you can compare that value to the hash of the received bytes to confirm the content arrived intact and was not modified in transit. The hash is computed by the server on upload and does not change unless the file is replaced.
Typical uses
The File Server is built for two audiences.
- Agents and scripts. A PowerShell or Bash script on a device fetches a file by its download URL, checks the returned hash against the published
SHA512, then acts on the content. This is the standard way to distribute a large binary that would be awkward to embed in a script. - Technicians. A private URL with a password lets you hand a customer one link to an installer or log bundle without giving them access to the rest of the File Server.
Dialogs
- Create Directory — enter a folder name to create a subdirectory in the currently open path.
- Rename — rename the selected file or folder.
There is no dedicated "Add File" dialog; the native file picker handles uploads.
Permissions
| Flag | Gates |
|---|---|
file_server_enabled | Opening the File Server page. |
file_server_add | Upload and create-folder actions. |
file_server_edit | Edit affordances on file metadata. |
file_server_delete | Deleting files and folders. |
file_server_netlock | Access to the /netlock folder. |
9.2 Relay Server
The Relay Server at /relay_server is the console-side view of persistent and temporary relay tunnels. A relay session proxies a single TCP port from a target device out to a connection endpoint your workstation can reach, so you can open a Remote Desktop, SSH, web admin, or database session against a device that is not directly reachable on your network.

How a relay session works
A session has three parties. The device runs the Relay App, which registers with the Remote Server and stands ready to proxy traffic. The Remote Server holds the session definition and accepts connections from your workstation on the configured relay address. Your workstation opens a TCP connection to that relay address, which the Relay App forwards to the Remote Server, which forwards it to the chosen agent, which forwards the connection to the chosen port on the device.
Everything in the tunnel is a single TCP stream. There is no UDP relaying, no multi-port session, and no protocol interpretation — the relay does not care whether the bytes are SSH, RDP, HTTP, or something else.
Persistent versus temporary sessions
Every session is either persistent or temporary:
- Persistent sessions are stored in the server's database. They survive a server restart and can be re-enabled long after they were first configured. Use persistent sessions for sites or services you expect to connect to repeatedly.
- Temporary sessions live only in server memory. They are gone as soon as the session is closed or the server is restarted. Use temporary sessions for one-off troubleshooting where the session definition is not worth keeping.
A persistent session can be toggled on or off from the list; a disabled persistent session keeps its definition but refuses new connections until you re-enable it.
Lifecycle states
A session's Status column shows one of:
Active— a client is currently connected and bytes are flowing.Ready to connect— the session is registered and waiting for a client.Device offline— the target device's Relay App is not currently registered, so the session cannot complete.Disconnecting— the session is in the process of tearing down.Disabled— a persistent session that has been turned off via the toggle.Inactive— the session exists but has no registered Relay App.
List columns
The list shows:
Device— device name, with the owning tenant name beneath.Target Port— the port on the device being proxied.Protocol—TCP.Status— one of the lifecycle states above.Connections— current count of connected clients.Persistent—Yesfor stored sessions; blank or aTempindicator for in-memory sessions.Enabled— toggle, shown on persistent sessions only.Actions— per-row controls.
Per-session actions
The Actions column exposes three controls:
- Copy Connection String — copies the relay address to the clipboard so you can paste it into your RDP client, SSH client, or browser.
- Enable / Disable — toggles a persistent session on or off. Not shown on temporary sessions.
- Close / Delete — closes the session and removes it from the relay server. For persistent sessions this also removes the stored definition.
How the Relay App registers
There is no discovery flow in the console. The Relay App on the device authenticates to the Remote Server using an API key and registers the sessions it is willing to serve. From that point the console can list those sessions and manage their lifecycle. Two account-area dialogs expose the API-key side of the integration:
- The Relay Identities Overview lists the API keys associated with the current admin.
- The Relay Account dialog holds the relay account settings for the current admin.
Both live in the account menu, not on the Relay Server page itself.
Create a relay session
The Create Relay Session dialog is the primary affordance for starting a new session.

Fields, in order:
Tenant— scopes the device picker.Location— scopes further within the tenant.Group— optional; scopes further within the location.Device— an autocomplete picker populated by the scope above.Port— a dropdown pre-populated with the common services used through relays:RDP,SSH,HTTP,HTTPS,VNC,MySQL,PostgreSQL, and others. Pick a preset or type a port number directly.Protocol—TCP. No other protocols are currently supported.Description— free text for your own reference.
Submitting the dialog registers the session with the Remote Server. If the target device's Relay App is online, the session becomes Ready to connect immediately; otherwise it waits in Device offline until the Relay App registers.
Tip: For long-lived sessions you will reconnect to, enable the
Persistentflag (on the list once created) rather than re-creating a temporary session each time. Persistent sessions keep their relay address across restarts.
Permissions
| Flag | Gates |
|---|---|
relay_server_enabled | Opening the Relay Server page. |
relay_server_manage | Managing API keys used by the Relay App. |
relay_server_add | Creating a new relay session. |
relay_server_edit | Enabling or disabling a persistent session. |
relay_server_delete | Closing or deleting a session. |
9.3 Website Uptime Monitoring
Website Uptime Monitoring at /website-uptime-monitoring watches external URLs from the server side. The server fires HTTP requests at each configured target on an interval, evaluates the response against a set of rules, and raises events when thresholds are breached. This is the right feature for public-facing sites, customer portals, and any HTTP endpoint where you care about availability or performance as seen from outside the device fleet.

Architecture
Checks run on the server. No agent is involved, which means a monitor sees the target from the network the server sits on — not from inside any particular customer's LAN. This matches how an external customer would reach the site, which is usually what you want for public endpoints. For internal-only URLs, consider a device-side sensor instead (see Chapter 8.3).
The three tabs
The page has three tabs, selected across the top:
Monitors— the list of configured targets, their current status, and the affordances for add / edit / delete.Details— historical timeline for a selected monitor: response time, SSL certificate, DNS lookup, and content-check results over the chosen window.Incidents— the chronological list of raised incidents across all monitors, with start time, duration, and the reason that triggered the incident.
What a monitor checks
Each monitor performs a single HTTP request per interval and evaluates the response on multiple axes:
- HTTP status. A target has an
Expected Status Code(default200). Anything else is a failure. - SSL certificate. If SSL monitoring is enabled, the monitor inspects the certificate chain for valid-from and valid-to dates, the issuer, subject, and thumbprint. Expiry raises a warning at the configurable warning-threshold days and critical at the critical-threshold days.
- Response time. The monitor records round-trip time and time-to-first-byte in milliseconds. A configurable threshold raises a
Degradedstatus when exceeded. - DNS resolution. If DNS monitoring is enabled, the monitor records lookup time and the resolved
A,AAAA, andMXrecords. - Content presence. With content monitoring enabled, the monitor checks the response body for a configured
Keywordand for a configuredCSS Selector. Either missing raises a content error. - Defacement detection. When enabled, the monitor stores a SHA hash of the response content and alerts when the hash changes unexpectedly.
The outcome of each check is written to the monitor's history and, where thresholds are breached, produces an event under the Uptime Monitoring type (see Chapter 12.2).
List columns (Monitors tab)
Status— one ofUp,Down,Degraded,Timeout,SSL Error,DNS Error,Content Error,Pending.Name— the monitor's label.URL— the target, truncated to fit the column.Interval— the check cadence, formatted (for example5m).Last Check— timestamp of the most recent check.Failures— running count of consecutive failures.Tenant— the tenant the monitor belongs to.Actions— edit / delete controls.
Creating a monitor
The monitor dialog is organised into eight sections:

- General —
Tenant,Name,URL,Enabled. - HTTP Settings —
HTTP Method(GET,POST,HEAD,PUT) andExpected Status Code. - Intervals & Timeouts —
Check Interval(default 300 s, range 30 to 86400 s),Timeout(default 30 s, range 1 to 120 s), andRetry Count(default 3, range 1 to 10). - Redirects —
Follow RedirectsandMax Redirects(default 5). - SSL Monitoring — enable, warning threshold days (default 30), critical threshold days (default 7).
- Content Monitoring — enable,
Keyword,CSS Selector, and the Defacement Detection hash toggle. - DNS Monitoring — enable.
- Performance Thresholds —
Response Time Alert(default 2000 ms),Load Time Alert(default 5000 ms), andSLA Target(default 99.90%). - Notifications — per-channel checkboxes for
Email,Microsoft Teams,Telegram,ntfy.sh, andWebhook. Each channel must be configured inSettings → Notificationsfirst.
The same dialog covers add and edit; the title changes based on which action opened it.
Incidents
The Incidents tab collates the consolidated timeline of raised incidents. An incident starts when the first failing check crosses its threshold and closes when the target recovers. Each row shows the triggering reason (for example Down, SSL Error, Degraded), the monitor, the duration, and the recovery time.
Permissions
| Flag | Gates |
|---|---|
website_uptime_monitoring_enabled | Opening the Website Uptime Monitoring page. |
There are no granular add / edit / delete flags — access is all-or-nothing at the page level, with tenant scoping applied through the standard tenant-list permission.
9.4 Port Scanner
Port Scanner at /port-scanner sweeps a manually-configured list of targets for open TCP ports and tracks the findings against an allowlist. Use it to catch drift on internet-facing hosts — a newly opened port that shouldn't be open, a forgotten staging service exposed to the internet, or an unexpected change to a web server's Server banner.

Compliance scope — targets only
The Port Scanner scans only manually-configured custom targets. It does not enumerate the devices in your fleet and scan their external IPs. This behaviour is intentional and enforced: the Settings tab states that automatic scanning of device external IPs has been disabled for compliance reasons. If you want a host scanned, you must add it yourself as an explicit target.
The five tabs
The page has five tabs across the top:
Scan Results— the findings table, one row per discovered open port per scan.Custom Targets— the targets the scanner sweeps, one host per row.Whitelist— the allowlist of host+port pairs that should be treated as expected rather than as a finding.Ports— the catalogue of port numbers the scanner will test on each target.Settings— global scanner configuration.
Custom Targets
Targets are added one at a time from the Custom Targets tab. Each target has a Tenant, Name, Host (hostname or IP address), and Description, plus an enabled/disabled toggle. The scanner only sweeps enabled targets.
Ports catalogue
The set of ports tested is global — not per-target. The Ports tab lets you add a port (1–65535), give it a Name (the service label shown against findings), and a Details field for notes. Each port can be enabled or disabled. A disabled port is skipped during scans but kept in the catalogue for later.
This design assumes you care about the same port numbers everywhere. If you need a different port set for a particular target, the current implementation is to maintain a single unified catalogue and filter findings by the target column of the results view.
Whitelist
The Whitelist tab is the allowlist. A whitelist entry has Tenant, Name, Host (or * for any host), Port (or 0 for any port), and Description. A finding that matches a whitelist entry is treated as expected and is not surfaced as a concern on the Scan Results tab.
Use * host plus a specific port for "this port is always OK to be open anywhere", and a specific host plus 0 for "any port being open on this host is OK".
Settings
Global scanner configuration:
- Protocols — TCP only. UDP scanning is not implemented.
- TCP timeout — milliseconds per port probe, default 3000, range 500 to 30000.
- Scan interval — hours between automatic scans, default 24, range 1 to 720.
- Max concurrent scans — maximum parallel port probes, default 50, range 1 to 500.
- Auto-cleanup — retention in days for old results, default 90.
A Trigger Scan Now button on the Settings tab runs an on-demand scan outside the interval.
Scan Results columns
Host— the target host.Port— the discovered open port.Service— the service label from the Ports catalogue entry for that port.Target— the device name if the host maps to a known device; otherwise blank.Banner— the first bytes returned by the service, where available.Title (HTTP)— the<title>element of the HTTP response, if served.Title (HTTPS)— the<title>element of the HTTPS response, if served.Scan Date— the timestamp of the scan that produced this row.Actions— per-row controls, including opening the result details dialog.
Dialogs
- Add / Edit Custom Target —
Tenant,Name,Host,Description. - Add Whitelist Entry —
Tenant,Name,Host,Port,Description. - Add / Edit Port —
Port Number,Name,Details. - Scan Result Details — read-only display of host, port, service, banner, titles, and scan date for a single finding.
Permissions
| Flag | Gates |
|---|---|
port_scanner_enabled | Opening the Port Scanner page. |
Tenant scoping on the Custom Targets, Whitelist, and Scan Results tabs is enforced through the standard tenant-list permission.
Permissions
The File Server, Relay Server, Website Uptime Monitoring, and Port Scanner each have their own flags. The complete list for this chapter:
| Flag | Gates |
|---|---|
file_server_enabled | File Server page. |
file_server_add | Upload and create folder. |
file_server_edit | Edit file metadata. |
file_server_delete | Delete files and folders. |
file_server_netlock | /netlock folder. |
relay_server_enabled | Relay Server page. |
relay_server_manage | Relay API keys. |
relay_server_add | Create relay session. |
relay_server_edit | Enable or disable a persistent session. |
relay_server_delete | Close or delete a session. |
website_uptime_monitoring_enabled | Website Uptime Monitoring page. |
port_scanner_enabled | Port Scanner page. |
See Appendix X.2 for the full permission catalogue.
Related chapters
- Chapter 8 — Collections covers device-side sensors, which are the right choice for monitoring URLs or ports from inside a customer network.
- Chapter 12 — Events & Audit documents how Website Uptime and Port Scanner events appear in the Events view.
- Chapter 3 — Devices describes remote control, which complements the Relay Server for interactive sessions.
- Appendix X.5 — Integration endpoints lists the notification endpoints that uptime monitors and port scanner results can reach.
Tickets
10.1 Overview
The Ticket System turns NetLock RMM into a lightweight helpdesk. Tickets capture requests and incidents raised by end users or ingested from email, carry a status through to resolution, and record every action taken along the way. The module is self-contained: it has its own contact list, its own SLA engine, and its own audit log on each ticket rather than funnelling changes into the global Events or Audit streams.
Three operator surfaces make up the day-to-day experience: the Tickets list at /tickets, Time Tracking at /tickets/time-tracking, and Statistics at /tickets/statistics. Configuration sits under the same menu group (Departments, Customers, Contacts, Templates), with dialogs for Labels & Types, SLA, and per-department Webhooks. Global defaults live on Settings → Ticket System.

10.2 Enabling the ticket system
The module is off by default. Two things have to line up for an operator to see the Tickets menu: the module must be turned on globally, and the operator must hold the tickets_enabled permission.
The master toggle is at Settings → Ticket System on the General tab, labelled Ticket System Enabled. Two other settings on the same tab apply deployment-wide:
Ticket Number Prefix— the prefix used in generated ticket numbers. The shipped default isTKT, producing identifiers such asTKT-000123. Individual customers can override the prefix on their own record (see 10.11); the global value is used wherever no customer override exists.Blocked File Extensions— a chip input with one file extension per chip. Attachments with these extensions are stripped from inbound email before the ticket is created, and an internal note on the ticket names the files that were blocked. Extensions are normalised to lowercase with a leading dot, so.EXE,exe, and.exeall match.
The Settings page itself is gated by settings_system_enabled. The two extra tabs on the same page (Labels & Types and SLA) manage the same data as the dialogs reachable from inside a ticket.
10.3 The tickets list page
Route: /tickets. The queue. It opens on the Open tab by default, refreshes every 60 seconds in the background, and raises a toast whenever a new inbound email or reply arrives on a ticket the current user can see.

Columns
The list carries nine columns: Ticket #, Subject, Contact, Status, Priority, Last Contact (direction badge plus a relative time), SLA (a colour-coded urgency chip), Updated, and Assigned To. Column order is user-configurable — drag the header to rearrange — and the chosen order is persisted in the browser's local storage, so it follows the operator across sessions on the same browser but is not shared between machines.
Status tabs, filters, and search
Six tabs sit above the table: All, Open, In Progress, Waiting, Resolved, Closed. Each tab shows a live count for the current filter set; switching tabs swaps the underlying query but preserves filters, search, and column order. Closed rows are dimmed so they don't visually compete with active work on the All view.
Five filter dropdowns narrow the query:
Department—All Departmentsor a named department. Users withouttickets_view_all_departmentssee only their own department regardless of this control.Priority—All,Critical,High,Medium, orLow.Assigned To—All,Unassigned, or any operator by username.Type— options drawn fromLabels & Types(see 10.14).Label—Allor any colour-coded label.
Filter selections stack. A single search field sweeps Ticket #, Title, Contact Email, Contact Name, and the Assigned To username at once.
Bulk toolbar
Selecting one or more rows reveals a toolbar with Close Selected, Delete Selected, and Deselect All. Close Selected moves every chosen ticket straight to Closed without prompting for a closing comment — use the detail dialog (see 10.4) when you need to record one. Delete Selected is gated by tickets_delete and is a hard delete; there is no recycle bin.
10.4 The ticket detail view
Clicking a row opens the ticket detail dialog. Its title shows the ticket number followed by a coloured chip for the current status. The body is a six-tab editor: Conversation, Details, Time Tracking, History, Attachments, and AI.

Conversation
The Conversation tab is the primary working surface. A toggle at the top switches between Chat View — bubble layout with alternating alignment — and List View — a denser CRM-style stack. Both render the same messages in chronological order.
Every message carries a direction badge that also determines its styling:
Internal note— left-aligned, tinted for internal use, marked with a lock icon. Not sent to the customer.Outbound— right-aligned, tinted blue, with an arrow-out icon. Delivered over the department's SMTP.Inbound— left-aligned, tinted green, with an arrow-in icon. Ingested from the department's IMAP mailbox.
A composer sits at the bottom of the tab with three editor modes: Rich Text, HTML, and Plain Text. Regardless of mode, both a rich-text rendering and a plain-text fallback are persisted, so replies display correctly for recipients that strip HTML. A lock/globe icon toggles the outgoing message between Internal note and Outbound before sending, and a Template Picker button inserts a saved response (see 10.13) — the composer remains editable after insertion.
Details

The Details tab exposes every metadata field on the ticket:
Title.Status—Open,In Progress,Waiting,Resolved, orClosed.Priority—Low,Medium,High, orCritical.Assigned To Operator.Support Department.Contact Name— read-only when a contact is linked; edit the contact on the Contacts page to change it.Contact Email— an autocomplete-searchable input when editable. If the entered email has no matching contact, aCreate Contactaction appears alongside so the operator can spawn one without leaving the dialog.Type— a clearable dropdown.Labels— multi-select with the colour of each label previewed inline.Created / Source— captions rather than editors.SourcereadsManualfor tickets created from the UI andEmailfor tickets ingested from a department mailbox.
Edit rights split across two flags. Every field on this tab except Assigned To Operator is gated by tickets_edit; the assignee dropdown alone is gated by tickets_assign. A user who can reassign but not edit sees every other field disabled and the assignee dropdown live.
Time Tracking
The per-ticket Time Tracking tab opens with an alert reporting the state of the auto-timer: when the department has automatic time tracking enabled (see 10.10), opening this ticket starts a timer, and the timer pauses after the department's configured idle timeout.
A collapsible Add Entry form books time manually with Date, Start Time, End Time (24-hour clock), and Notes; Duration is computed read-only. Below the form, a table lists every entry on the ticket — User, Date, Start, End, Duration, Rounded (reflecting the department's rounding step), Notes, and a Delete action — and a footer summarises raw and rounded totals.
History
The History tab is the ticket's own audit log. Every status change, assignee change, field edit, and comment addition appends an entry automatically. Each row captures the author, the date and time, the field that changed, and the old and new values. This tab is the authoritative record of activity on a ticket — ticket changes do not appear in /events or /audit; see 10.17.
Attachments
The Attachments tab gathers every file attached to the ticket — whether it arrived on a comment, as an inbound email attachment, or via a direct upload — into a single table with File Name, Size, Type (MIME), Uploaded By, Date, and Actions.
Every attachment offers Download. A second action, View, appears for text-like types (.txt, .log, .json, .xml, .csv, and anything with a text/* MIME) and renders the file in an inline viewer so operators can read logs, JSON, or XML without leaving the dialog.
AI
The AI tab is present only when the AI module is enabled globally (see Chapter 13). It offers Summarize Ticket, which produces a short summary of the conversation so far, and a free-form question field for chat-style Q&A scoped to this ticket. Output renders in paper-style cards. Both features use the provider and model configured in the AI & LLM settings.
10.5 Ticket lifecycle
A ticket moves through five statuses: Open, In Progress, Waiting, Resolved, and Closed. Any-to-any transitions are allowed — there is no state machine, so an operator can move a ticket from Closed back to Open in a single step.
Three routes lead to Closed: change Status to Closed on the Details tab and save; open the dedicated Close Ticket confirmation, which prompts for an optional Closing Comment persisted as an internal note on the ticket; or select rows on the list and use Close Selected in the bulk toolbar, which does not offer a closing-comment prompt.
Closing a ticket never deletes it. Closed tickets remain visible in the Closed tab and in All, dimmed slightly so they stand apart from live work. Reopening is a plain status change — set Status back to Open or In Progress and save. The Reopened Tickets metric on the Statistics page tracks how often that happens.
Tickets can also be closed automatically by a scheduled sweep; the per-department Cleanup settings control how long a ticket must be inactive before it's caught (10.10).
10.6 Creating a ticket
The New Ticket button on the list opens the create dialog. Creation is gated by tickets_create.

One field is required: Title. Submitting an empty title raises a Title is required validation error. Every other field is optional:
Department— falls back to the user's default department if left blank.Priority— defaults toMedium.Contact— autocomplete over existing contacts; typing searches name, email, and company.Contact Email— can be entered directly without selecting a contact. A contact can be created later from the detail dialog usingCreate Contacton theDetailstab.Assigned To— the initial assignee.Type.Description— the opening message. If provided, it becomes the first comment on the ticket, styled asOutboundand authored by the creator.
Creating the ticket auto-fills the following:
Ticket #— generated from the customer's prefix when the matched contact belongs to a customer that sets one, otherwise from the globalTicket Number Prefix, plus a sequential number.Source—Manual(Emailis reserved for tickets ingested from a mailbox).Status—Open.Created DateandCreated By— set from the current session.SLA— if the contact's email resolves to a customer with an SLA attached, the SLA's deadlines are computed and stored on the ticket.
The ticket_created webhook fires on save (see 10.16).
There is no device picker on this form. Tickets reach devices through the contact: a contact can have linked devices inside their tenant, and those devices surface on the Details tab once the ticket is saved. See Chapter 3 for the device side of that linkage.
10.7 Assignment and escalation
A ticket's Assigned To Operator is manual by default — an operator with tickets_assign picks an assignee from the dropdown. There is no queue-based round-robin or weighted distribution.
The only automated path to an assignee is Auto-assign on open, a per-department switch on the Departments admin page. When enabled, the first operator in that department to open an unassigned ticket becomes its assignee; the handoff is passive, triggered by opening the detail dialog.
SLA-driven escalation is event-based, not action-based. Tickets under an SLA carry a deadline and the list shows the current urgency as a coloured chip. When the deadline crosses a warning threshold the department's Notifications fire sla_warning, and on breach they fire sla_breached. Those events drive email notifications and webhooks (10.16). The module does not reassign tickets automatically when an SLA is at risk — a human makes that call.
10.8 Time tracking
Requires permission:
tickets_view_time_tracking.
Route: /tickets/time-tracking. The page is a single-day calendar showing every time entry across every ticket the operator can see.

A vertical 24-hour timeline runs from midnight to midnight with half-hour gridlines. Entries are rendered as coloured rectangles positioned by their start and end times. The colour encodes origin: manual entries are blue, automatic entries — booked by the auto-timer — are green. On today's view, a red indicator tracks the current time.
A sidebar lists the same day's entries in chronological order with a delete button on each row. Navigation across days uses Previous, Next, a date picker, and a Today shortcut.
Each entry records Date, Start Time, End Time, Duration (computed), Rounded Duration, and Notes, plus an internal flag noting whether it was booked manually or automatically. The rounded duration applies the department's Rounding (minutes, 0 = exact) step; with 0 the rounded value equals the raw duration.
Automatic tracking is driven by three department settings:
Idle Timeout (minutes)— after this many minutes without activity on the ticket, the timer pauses. The next interaction resumes it as a new entry.Confirm Timeout (minutes)— after this many minutes, the operator is prompted to confirm they're still working on the ticket. Without a confirmation the current entry stops.Rounding (minutes, 0 = exact)— the increment theRounded Durationsnaps to.
The page has no export control of its own; aggregate figures live on the Statistics page.
10.9 Statistics
Requires permission:
tickets_view_statistics.
Route: /tickets/statistics. The page is a tabbed dashboard covering activity over a chosen time window.

A filter row at the top controls scope for every tab: a date-range picker (defaulting to the last 30 days), plus Department, Customer, and Operator dropdowns, and an Apply button that re-runs the query.
Five tabs group the metrics by category:
Overview— volume and quality indicators across the whole scope: totals, per-status counts, average resolution and first-response times, SLA compliance, priority and source breakdowns, busiest day and hour, reopens, and so on.Departments— one row per department with the key volume and SLA figures.Customers— one row per customer with volumes, hours, and SLA compliance.Operators— one row per operator with workload and outcome figures, plus an operator-by-customer hours matrix.Trends— distributions across labels and types.
Individual metrics are not enumerated here — the tab layout and filter scope matter more for day-to-day use than the exact list, and the composition evolves with each release. The on-page labels name each metric clearly.
10.10 Departments
Requires permission:
tickets_manage_departments.
Route: /tickets/departments. Departments are the organisational and technical unit of the ticket system. They carry their own mailbox, their own notification recipients, their own time-tracking behaviour, their own webhooks, and their own membership list.

The list columns are Name, Description, IMAP Server, SMTP Server, Members, Enabled, and row-level actions.
The create and edit dialogs share the same field set, grouped into sections:
- General —
Name,Description,IMAP Server,IMAP Port,IMAP Username,IMAP Password,SMTP Server,SMTP Port,SMTP Username,SMTP Password,From Address,From Name,Enabled, andAuto-assign on open. - Auto-Reply Email —
Subject,Body (HTML), and an enabled toggle. Two placeholders resolve at send time:{{ticket_number}}and{{subject}}. Fires once per new ticket created from inbound email. - Follow-Up Reminder Email —
Send after X days without reply,Subject,Body (HTML), and an enabled toggle. Fires once per ticket when the customer has gone silent for the configured number of days. - Time Tracking —
Idle Timeout (minutes),Confirm Timeout (minutes),Rounding (minutes, 0 = exact), and an enabled toggle. Drives the auto-timer described in 10.8. - Cleanup —
Close tickets inactive for (days),Auto-close tickets with these statuses(checkboxes forOpen,In Progress, andWaiting),Internal note added to auto-closed tickets,Delete closed tickets older than (days), andAlso delete attachment files from disk. - Notifications —
Notification Recipients(comma-separated email addresses) plus an event-checkbox list:Ticket Created,Ticket Updated,Ticket Closed,Ticket Assigned,Comment Added,SLA Warning,SLA Breached, andAuto-Closed. Each selected event sends an email to every listed recipient. - Webhooks — a
Manage Webhooksbutton opens the webhook dialog scoped to this department. See 10.16. - Members — a multi-select of the operators in this department. Membership combines with
tickets_view_all_departmentsto determine who sees which tickets.
Email ingestion is per department. Each department polls its own IMAP mailbox; inbound messages create tickets in that department, and outbound replies are sent through that department's SMTP. There is no single global mailbox — to accept mail for multiple addresses, run multiple departments. Deletions are hard deletes.
10.11 Customers
Requires permission:
tickets_manage_customers.
Route: /tickets/customers. Customers are the company records the ticket system operates against. A detail page lives at /tickets/customers/details for editing one customer in depth.
List columns: Company, Tenant, SLA, Prefix, and a contacts count. Creating a customer uses the Add Company dialog with these fields:
Company Name.Address.Linked Tenant— the RMM tenant this customer maps to. The linkage scopes which devices can later be attached to the customer's contacts.SLA— picks an entry from the SLA library; see 10.15.Ticket Number Prefix— overrides the global prefix for this customer's tickets. Use something short and recognisable, such asACME.Notes.
The customer detail page lets an admin edit the same fields and also surfaces the company's departments, contacts, and tickets in one place, with device links attached to each contact visible inline.
Warning: Deleting a customer is a hard delete with cascade. All departments tied to that customer, all its contacts, and the device links on those contacts are removed permanently. Remove customers only when you are sure they are gone for good.
10.12 Contacts
Requires permission:
tickets_manage_customers.
Route: /tickets/contacts. Contacts are the individual people tickets are tied to. Every ticket references a contact; the contact in turn belongs to a customer, which is how the customer's SLA and prefix reach the ticket.
List columns: Last Name, First Name, Email, Phone, Position, Company, Department, and a linked-devices count. Create and edit fields are First Name, Last Name, Email, Phone, Position / Role, Company, Department, Notes, and Linked Devices. Device linking is a multi-select that only becomes available once a company is chosen — the device list is scoped to the company's linked tenant, so you can only attach devices that live in that tenant.
Contacts are also maintained inside the customer detail page. The flat /tickets/contacts page is an alternative view of the same records, convenient when you are looking for one person without knowing which customer they belong to. Deletions are hard deletes.
10.13 Templates
Requires permission:
tickets_manage_templates.
Route: /tickets/templates. Templates are saved responses reusable across tickets. List columns: Name, Type (Email or Ticket), Subject, Author, Date, and an actions column.
Create and edit fields are Name, Type, Subject, and Body. The body editor offers the same three modes as the ticket composer — Rich Text, HTML, and Plain Text — and both a rich-text rendering and a plain-text fallback are persisted so the recipient sees something sensible regardless of their mail client.
The Type field reflects where the template is meant to be used: Email templates for outbound replies, Ticket templates for internal notes and descriptions on newly created tickets. Both types appear in the Template Picker; the distinction is organisational rather than enforced.
The Template Picker is available from the ticket composer and from the new-ticket dialog. Picking a template populates the subject and body of the composer and leaves both fully editable. Deletions are hard deletes.
10.14 Labels and Types
Requires permission:
tickets_manage_labels_types.
Labels and Types are managed in two places: a Labels & Types dialog reachable from the ticket detail dialog and from the Settings area, and a Labels & Types tab on Settings → Ticket System. Both surfaces manage the same data.
Labels are colour-coded tags. Each label has a Label Name and a Color chosen from a hex picker. Multiple labels can be applied to the same ticket — the Details tab's label picker is multi-select. Labels are additive metadata: they don't affect routing or SLA behaviour, they just help you filter and categorise on the list.
Types are single-value categorisations. Each type has a Type Name and a Description. A ticket has at most one type.
Note: Types are user-defined. NetLock RMM does not ship a pre-configured list, and in particular does not provide the ITIL set (
Incident,Service Request,Change,Problem) out of the box. Define whatever set fits your workflow.
Deletions are hard deletes with no confirmation prompt — double-check before clicking.
10.15 SLA
Requires permission:
tickets_manage_sla.
SLAs are managed from an SLA Management dialog and from the SLA tab on Settings → Ticket System. Both edit the same records.
List columns: Name, Response (h), Resolution (h), Priority Override, Description, and an actions column.
Each SLA carries:
Name.Response Time (hours)— the deadline for the first outbound response to the customer.Resolution Time (hours)— the deadline to reach a resolved status.Priority Override— one ofNone,Low,Medium,High, orCritical. Acts as a minimum priority floor: tickets under this SLA cannot drop below the override.Description— free text.
SLAs attach to customers on the Customers page (see 10.11). When a ticket is created from a contact of that customer, the SLA's response and resolution deadlines are computed from the creation time and stored on the ticket. The list view's SLA chip transitions through ok, warning, critical, and breached colours as the deadline approaches.
Note: SLA timers are wall-clock hours. There is no business-hours calendar — a 4-hour response time means four real hours, counted continuously including nights and weekends. Plan thresholds around that reality.
SLA timer transitions feed Notifications and Webhooks through the sla_warning and sla_breached events. Deletions are hard deletes.
10.16 Webhooks
Requires permission:
tickets_manage_webhooks, granted through the department-edit context.
Webhooks are configured per department, not globally. From the department edit form, Manage Webhooks opens the webhook dialog, which lists the department's webhooks and offers create, edit, test, and delete actions.

Each webhook has the following fields:
Name— shown in the list.Description— free text.URL— required; the endpoint the request is sent to.Method— one ofGET,POST,PUT,DELETE, orPATCH.Request Body— a JSON document edited in an embedded Monaco editor, with placeholder substitution at send time.Request Headers— a JSON object edited in Monaco. Defaults to{"Content-Type": "application/json"}.Events— zero or more trigger events. Selecting none means the webhook fires for every event.Enabled— toggle.
The eight event triggers are ticket_created, ticket_updated, ticket_closed, ticket_assigned, comment_added, sla_warning, sla_breached, and auto_closed.
Ten placeholder tokens are substituted in the request body: {{ticket_number}}, {{subject}}, {{status}}, {{priority}}, {{assigned_to}}, {{customer}}, {{department}}, {{event}}, {{timestamp}}, and {{url}}.
The dialog pre-populates new webhooks with the following default body. Adjust it to the shape your integration expects.
{
  "event": "{{event}}",
  "ticket_number": "{{ticket_number}}",
  "subject": "{{subject}}",
  "status": "{{status}}",
  "priority": "{{priority}}",
  "assigned_to": "{{assigned_to}}",
  "customer": "{{customer}}",
  "department": "{{department}}",
  "timestamp": "{{timestamp}}",
  "url": "{{url}}"
}
A Test action sends a single request filled with sample placeholder values. Before sending, the dialog validates that the URL is well-formed and that the body and headers parse as JSON, so a misconfigured webhook fails at save time rather than at the next real event.
10.17 Notifications and Events integration
Three notification channels run in parallel for tickets:
- Email — per department. The
Notification Recipientslist plus theNotify on these eventscheckboxes decide who is emailed and for which events. Sending uses the department's SMTP configuration. - In-app toasts — a live notification service pushes toasts to the Console on new tickets, replies, and updates.
- Unread counter — the
Ticketsentry in the navigation carries a badge showing unread ticket activity for the current user.
Webhook delivery is a separate fourth channel, covered in 10.16.
Note: Ticket changes do not appear in
/eventsand do not appear in/audit. The ticket's ownHistorytab is the authoritative activity log for every change on a ticket. If you went looking for a ticket in the global Events or Audit streams and did not find it, this is why — open the ticket itself and read theHistorytab.
For wider context on how each notification channel is configured (SMTP, Teams, Telegram, Ntfy, webhooks), see Appendix A.8.
10.18 Permissions
The ticket module uses a dedicated set of permission flags that gate every part of the experience. The global Settings → Ticket System page has its own flag as well, because it lives under Settings.
| Flag | What it gates |
|---|---|
tickets_enabled | Access to the Tickets menu and the /tickets page. Required for any other ticket permission to take effect. |
tickets_create | The New Ticket button on the list and the create dialog. |
tickets_edit | Editing the fields on the ticket detail dialog's Details tab (except the assignee). |
tickets_delete | Deleting tickets from the list and from the detail dialog. |
tickets_assign | Changing Assigned To Operator in the detail dialog. |
tickets_view_time_tracking | The Time Tracking page at /tickets/time-tracking. |
tickets_view_statistics | The Statistics page at /tickets/statistics. |
tickets_view_all_departments | Visibility of tickets outside the user's own department. Without it, the list filters down to the user's department only. |
tickets_manage_departments | The /tickets/departments admin page. |
tickets_manage_templates | The /tickets/templates admin page. |
tickets_manage_labels_types | The Labels & Types dialog and tab. |
tickets_manage_customers | The Customers and Contacts admin pages. |
tickets_manage_sla | The SLA Management dialog and tab. |
tickets_manage_webhooks | The webhook dialog inside a department. The UI reaches it from the department edit form, so tickets_manage_departments is a practical prerequisite. |
settings_system_enabled | The Settings → Ticket System page, including the master toggle, the global prefix, and the blocked-extensions list. |
See Appendix X.2 for the full permission catalogue across the product.
10.19 Related chapters
- Chapter 3 — Devices covers how devices are added to tenants. Contacts in this module link to those devices, which is how tickets reach the managed estate.
- Appendix A.8 — Notifications deep dive documents each notification channel (SMTP, Teams, Telegram, Ntfy, webhooks) in detail. The department
Notificationssection chooses which events fire; A.8 covers how each channel is configured. - How to handle a ticket from open to resolved is a task-focused walkthrough that puts the list, the detail dialog, time tracking, and closing into a single end-to-end example.
- Appendix X.2 — Permission reference collects every permission flag in the product, including the
tickets_*set used in this chapter.
Reports
The Reports page at /reports is the console's reporting surface. It is used to build, schedule, and distribute reports about the fleet — anything from a device inventory to a patch-compliance summary to a custom SQL-backed breakdown of job outcomes. The page also hosts the community reports browser and the brand templates that give generated PDFs a consistent look.

11.1 The four tabs
The page is organised into four tabs, selected across the top:
Templates— the library of report templates, both built-in and user-created. This is where you pick a template to generate, edit, share, publish, or duplicate.Generated— the list of already-produced reports, with filenames, timestamps, the template they came from, and download links for the output files.Schedules— the list of recurring report runs. Each row is a schedule attached to a template.Brands— brand templates that drive the cover page, colours, logo, and PDF footer of generated reports.
Templates drive everything. You start with a template; you generate or schedule from a template; you attach a brand to a template; you share or publish a template.
11.2 Templates
The Templates tab lists every report template you have access to. Two categories share the tab:
- Built-in templates ship with the product and are flagged with a
Built-inchip. AShow Built-incheckbox in the toolbar toggles their visibility so the list can be filtered down to your own templates when the built-in set is getting in the way. - Custom templates are created from the Templates tab's
Createaction, or by duplicating an existing template. They can be shared with other users via the Share Template dialog, published to the community via the Publish action, and imported from the community via the Community Reports browser.
Each template has an Author, a creation date, a description, and a list of widgets that define what the generated report contains. Templates are edited in the Report Builder (covered next).
Note: The set of templates marked built-in is defined in the product database, not hard-coded in the console. Which templates ship as
Built-independs on the database contents at installation.
Template actions
Row actions on a template include:
- Generate — open the Generate Report dialog for a one-off run (see 11.6).
- Schedule — open the Schedule dialog to attach a recurring run.
- Edit — open the template in the Report Builder.
- Duplicate — create a copy in your library, useful for editing a built-in without modifying the original.
- Delete — remove the template. Built-in templates cannot be deleted.
- Share — open the Share Template dialog to grant access to other users.
- Publish to Community — publish a template you own to the community repository.
11.3 The Report Builder
The Report Builder at /reports/builder (and /reports/builder/{id} when editing an existing template) is where a template is authored. A template is a sequence of widgets; the Builder is the editor for that sequence.

Each widget is backed by a data source — a SQL query that produces the rows the widget visualises. The Builder exposes two modes for authoring that query, gated by the user's permission level.
Visual Query Builder
The Visual Query Builder is the default mode and the one available to users who do not have admin-level report permissions. It exposes the query as a set of form controls:
Table— the table to select from, drawn from the administrator-configured list of allowed tables.Columns— the columns to include in the result.Fn— aggregate function applied to a column. The supported aggregates areCOUNT,SUM,AVG,MIN,MAX, andDISTINCT.Joins— a list of joins, each with a join type, a right-hand table, and anONcondition.Where— the filter conditions, composed withAND/ORlogic. Supported operators:=,!=,<,>,<=,>=,LIKE,IN,IS NULL,IS NOT NULL.Logic— per-clause grouping between conditions.Op,Value— the operator and right-hand side for each condition.- Order-by and limit controls round out the query.
The resulting SQL is composed by the Builder and stored on the widget.
God Mode SQL
A second mode, SQL Query (God Mode), is available when a deployment-wide setting enables it (reports_godmode in Settings). In God Mode the Widget Editor discards the visual controls and accepts raw SQL typed directly into the editor. The query runs against the full database schema — so this is the escape hatch when the visual builder cannot express what you need.
God Mode is a platform-level toggle, not a per-user permission. When the deployment has it off, no user — admin or otherwise — sees the God Mode field. When it is on, every user who can edit a report template can use it. Treat it as a deployment decision, made in Settings → Reports.
A companion AI SQL Assistant button drafts a query from a natural-language description. The AI only writes into the editor; you still review and run the query yourself.
Both modes store their output in the same widget field, so a template can mix widgets authored in either mode.
Tip: Start in the Visual Query Builder. Drop into God Mode only when you hit a real limitation — cross-schema joins, window functions, custom field values — because a Visual Query Builder query is easier to read, review, and hand off.
11.4 Widgets
A report is a sequence of widgets. Each widget is one of four types:
- Metric — a single number with a label. Use for headline figures: total devices, open incidents, unpatched criticals.
- Chart — a plotted series. Bar, line, and pie presentations are available depending on the widget configuration.
- Table — a tabular display of the rows the data source returns. The workhorse widget for inventory-style reports.
- Text — static markdown content, rendered in place. Use for narrative explanations, section headers within a report, or preamble paragraphs.

The Widget Editor
Each widget is authored and edited in the Widget Editor dialog. The dialog is divided between the widget's data source (handled via either the Visual Query Builder or God Mode SQL, as described in 11.3) and its presentation — the specific controls for the chosen widget type (axes, colours, column order, label text). The data source controls are shared across all widget types except Text, which is purely markdown and has no query.
11.5 Brand templates
Brand templates at the Brands tab let you define how a generated report looks — distinct from what it contains. A brand wraps the content of any template with a cover page and footer consistent with a specific customer, MSP unit, or product line.

The Brand Template dialog accepts:
- Company info — company name, address, contact details.
- Colours — primary and secondary colours used on the cover page and in section headers.
- Logo — the image shown on the cover page and (scaled) in the footer.
- Header text — the text line at the top of each generated page.
- Footer text — the text line at the bottom of each page.
- Custom fields — a list of key-value pairs rendered as cosmetic footer entries on the PDF cover page.
- Show custom fields in footer — a switch that controls whether those custom fields are actually rendered.
Custom Fields in reports — what they are and are not
Important: Custom Fields are not a queryable data source in the Report Builder. You cannot pick a Custom Field from a dropdown in the Visual Query Builder. Custom Fields appear in Reports in one place only: as cosmetic key-value pairs on brand template footers.
If you need Custom Field data in the body of a report — for example, a table of devices and their
Asset Tagcustom field — you must query the underlying tables directly inGod Mode SQL. There is no visual-builder path to custom field values.
A brand template is attached to a report template via the Report Builder. One brand can back many templates; a template with no brand uses the default styling.
11.6 Scheduled delivery
The Schedules tab lists scheduled runs; each row attaches a template to a cadence and a distribution method. Schedules are created from the Schedule dialog.

Frequency
The frequency selector offers:
HourlyDailyWeekly— with a day-of-week picker (Sunday through Saturday).Monthly— with a day-of-month picker (1 through 28).Quarterly— with a day-of-month picker.Annually— with a day-of-month picker.
Day-of-month is capped at 28 so scheduled runs always fire; there is no "last day of month" option.
Time
Time is expressed as Hour (0–23) and Minute (0–59), evaluated in the server's configured time zone.
Date range
The Date range selector controls the window of data the generated report covers:
auto— driven by the report template's own configuration.last_24hlast_7dlast_30dlast_quarterlast_year
Output format
The Export format control selects how the generated report is rendered:
PDF— paginated with the brand template applied.HTML— single-file HTML, handy for embedding in a customer portal or emailing inline.CSV— raw row data; suitable for further processing.JSON— structured form; suitable for downstream automation.
Distribution
Scheduled runs deliver through one of two channels:
- Email — the schedule carries a
Recipientsfield (comma-separated addresses), aSubject, and aBody. The rendered report is attached to the message. - Webhook — the schedule carries a
URL, an HTTPMethod(GET,POST,PUT,DELETE,PATCH),Request Headersas JSON,Request Bodyas JSON, and anAttach Filetoggle. WhenAttach Fileis on, the rendered report is sent as a multipart attachment; when off, only the request body is sent.
The distribution choice is per-schedule, not per-template — the same template can back one email-delivered schedule and one webhook-delivered schedule.
11.7 Output formats
Whether triggered from the Generate Report dialog or from a schedule, the output format is selected at run time:
| Format | Use |
|---|---|
PDF | Human-readable report with the brand template applied. The default for customer-facing output. |
HTML | Single-file HTML; renders in any browser and embeds in email bodies. |
CSV | Raw row data from each table widget. Strips charts and formatting. |
JSON | Structured representation of the report's data. Intended for downstream automation. |
PDF honours the brand template attached to the source template; the other formats ignore it.
11.8 Generating a report on demand
The Generate action on any template opens the Generate Report dialog — a one-off run.

Fields:
Template— pre-filled from the row you clicked.Format—PDF,HTML,CSV, orJSON.Date range— the same options as scheduled delivery.Email— optional; if filled, the generated file is emailed to that address. Leave blank to only produce the file (it lands on theGeneratedtab).
11.9 Community Reports
Report templates have a community sharing surface analogous to the one on Scripts. Four affordances drive it:
- Import — the
Community Reportsbutton opens the Community Reports browser. Filter, preview, and click to import a community template into your own library as a custom template. - Publish — the
Publish to Communitybutton on the Report Builder (visible when the template is yours) opens the Publish dialog. You provide a name, description, and metadata; the template JSON is posted to the Members Portal. - Report — flag a community template as abusive or incorrect.
- View — open the detailed metadata view for a community template before deciding to import.
Imported templates are normal custom templates from that moment on — editable, schedulable, and deletable.
11.10 Dialogs
The Reports page and its Builder share a set of dialogs:
| Dialog | Purpose |
|---|---|
| Generate Report | Run a template once, with format and date range. |
| Schedule | Create or edit a recurring run with distribution settings. |
| Widget Editor | Add or edit a single widget (metric, chart, table, or text). |
| Share Template | Grant other users access to a template. |
| Brand Template | Create or edit a brand (cover, colours, logo, footer). |
| Community Reports | Browse and import community templates. |
| Publish | Publish a template you own to the community. |
| Report | Flag a community template. |
| View | Preview a community template's metadata. |
| Delete Confirm | Confirm deletion of a template, schedule, or brand. |
Permissions
| Flag | Gates |
|---|---|
reports_enabled | Opening the Reports page. |
reports_create | Creating a template. |
reports_edit | Editing a template. |
reports_delete | Deleting a template. |
reports_generate | Running the Generate Report dialog. |
reports_schedules | Creating or managing schedules. |
reports_brand_templates | Managing brand templates. |
God Mode SQL is controlled separately by the deployment-wide reports_godmode toggle in Settings → Reports, not by a per-user permission.
See Appendix X.2 for the full permission catalogue.
Related chapters
- Chapter 8.4 — Custom Fields covers where Custom Fields live in the product and how to read their values via SQL when you need them inside a report body.
- Chapter 12 — Events & Audit is the source for generating event-oriented reports.
- Part III — How-To Guides includes a step-by-step for running a compliance report and scheduling email delivery.
- Appendix A.12 — Content defaults covers the system-wide report defaults configured in Settings.
Events & Audit
NetLock RMM keeps two separate logs, each answering a different question.
- Events answers "what happened on the devices?" — antivirus detections, job outcomes, sensor breaches, uptime-monitor failures, port-scan findings, device online/offline transitions.
- Audit answers "what happened in the console?" — who logged in, who changed a policy, who approved a patch, who deleted a user.
This split is deliberate. Events is operational; Audit is administrative. Events is filterable by severity and device; Audit is filterable by user and entity type. Events can be marked read or exported; Audit is append-only and cannot be pruned from the UI. Keep the two pages separate in your head and you will always be on the right one.

12.1 Scope split
Events and Audit are not duplicates of each other. The following split is the single source of truth:
| Source of the record | Logged in |
|---|---|
| Antivirus events from Microsoft Defender on a device | Events |
| Job execution outcomes on a device (scripts, deployments, policy pushes) | Events |
| Sensor threshold breaches from a device | Events |
| Website uptime-monitor checks | Events |
| Port Scanner findings | Events |
| Device online / offline transitions | Events |
| Application Control / Device Control block attempts on a device | Events (also on dedicated Blocked tabs — see 12.5) |
| Login success, login failure, logout | Audit |
| Any create / update / delete through the console | Audit |
| Permission or role change on a user | Audit |
| Script executed from the console | Audit (+ Events from the device side when the script runs) |
| Export of a list to JSON or HTML | Audit |
| Authorizing or deauthorizing a pending device | Audit |
Script execution is the classic case of a record landing in both logs. The Audit entry records that a console user initiated the run (action = execute, entity_type = script). The Events entry is emitted by the device after the script finishes (type = job), with the outcome and any output. Read one without the other and you are missing half the picture.
Application Control and Device Control blocks are surfaced in Events and on their own Blocked tabs — see 12.5.
12.2 Events
Manage Events at /events is the operational log.

List columns
The list shows:
| Column | Meaning |
|---|---|
Severity | critical, high, moderate, or low. Maps to DB values 3 / 2 / 1 / 0 but the UI shows the label. |
Date | Timestamp of the event. |
Tenant | The tenant the event's device belongs to. |
Location | The location under the tenant. |
Device | The device that produced the event. |
Reported By | The source subsystem — antivirus, job, sensor, uptime monitor, port scanner. |
Event | The event message. |
Filter controls
A filter bar across the top of the page narrows the view:
Time span— start and end date. Defaults to the last 7 days.Severity—Any,critical,high,moderate, orlow.Type—Any,antivirus,job,sensor,Uptime Monitoring, orPort Scanner.Tenant— dynamically populated from the tenants you have access to.Location— dynamically populated from the selected tenant.Show read events— checkbox, off by default. When off, events you have already opened are hidden.Show website uptime events— checkbox, on by default.Show port scanner events— checkbox, on by default.
The six event types
Events are categorised by type. The Type filter exposes five of them; a sixth exists but is not included in the dropdown:
| UI label | Source | Notes |
|---|---|---|
antivirus | Antivirus detections and signature updates from Microsoft Defender, plus Application Control and Device Control block events — all three share this type. | Distinguish the source by the Reported by field: Application Control [...] / Device Control [...] for block events. |
job | Job execution outcomes — success, failure, retry. Covers scheduled jobs, policy pushes, and deployment jobs. | Hidden jobs do not appear here (see next subsection). |
sensor | Sensor threshold breaches — notification threshold crossed, action threshold crossed. | Includes threshold-recovery events. |
Uptime Monitoring | Website uptime monitor state changes — Down, Recovered, Degraded. | Controlled by the Show website uptime events checkbox in addition to the filter dropdown. |
Port Scanner | Open ports discovered by the Port Scanner. | Controlled by the Show port scanner events checkbox in addition to the filter dropdown. |
| (no dropdown entry) | Device uptime — online / offline transitions. | Visible with the default filter; no dedicated checkbox. |
The Show website uptime events and Show port scanner events checkboxes are independent of the Type dropdown. If you pick Uptime Monitoring from the Type dropdown, the events are shown regardless of the checkbox state — the dropdown wins when it names a type explicitly.
Hidden jobs are excluded
Jobs marked Hidden in their library entry (see Chapter 8.2) are excluded from the Events view at query time. There is no checkbox that brings them back — they are not visible on this page at all, regardless of filter state. Use hidden jobs for background work that feeds Custom Fields or other non-operational data flows; use non-hidden jobs when you want the outcome surfaced here.
Event Details dialog
Clicking a row opens the Event Details dialog and marks the event as read.

The dialog has two tabs:
- Monaco — the event content rendered in a Monaco code editor with syntax highlighting. Best for output that is JSON, XML, or otherwise structured.
- RAW — the plain-text form of the same content. Use this when Monaco's highlighter guesses wrong or when you want to copy content verbatim.
When AI is enabled in Settings → AI/LLM, a third control appears: the Analyze with AI button. Clicking it hands the event content to the AI chat with the event context pre-filled, so you can ask the model to explain the event without copying and pasting it by hand.
Toolbar actions
The Events toolbar exposes:
Refresh— re-queries the server for the current filter.Mark all as read— marks every event currently visible as read.Export— exports the currently-filtered list asJSONorHTML.
There is no acknowledge affordance beyond mark-as-read and no delete affordance. Events remain on the server until retention rules (configured in Settings) remove them.
Permissions
| Flag | Gates |
|---|---|
events_enabled | Opening the Events page. |
Tenant scoping is applied through the standard tenant-list permission, so a user with access to tenants A and B will see events from devices in those tenants only.
12.3 Audit
Audit at /audit is the administrative log.

List columns
The list shows:
| Column | Meaning |
|---|---|
Severity | Info, Warning, or Critical. Maps to DB values 0 / 1 / 2. |
Date | Timestamp of the administrative action. |
User | The console user who performed the action. |
Action | One of the ten action categories (see below). |
Entity Type | One of the 18 entity types (see below). |
Entity Name | The specific entity the action applied to. |
Tenant | The tenant scope, if the entity is tenant-scoped. |
IP Address | The source IP of the user's session. |
Filter controls
Time span— default last 7 days.Severity—Any,Info,Warning, orCritical.Action—Anyplus the ten action categories.Entity Type—Anyplus the 18 entity types.User— drawn from the accounts that have ever produced an audit entry.
Action categories
Every audit entry has one of these ten actions:
| Action | When it fires |
|---|---|
create | A new entity is created (tenant, policy, script, job, and so on). |
update | An existing entity is edited. |
delete | An entity is deleted. |
login | A user successfully logs in. |
login_failed | A login attempt fails. |
logout | A user logs out. |
execute | A user triggers an execution, typically a script or deployment. |
export | A user exports a list to JSON or HTML. |
authorize | A user approves a pending device. |
deauthorize | A user deauthorises an authorised device. |
Entity types
Every audit entry has one of these 18 entity types:
| Entity Type | Scope |
|---|---|
session | Login / logout sessions. |
user | User accounts. |
user_permissions | A user's permission flags. |
tenant | Tenant records. |
location | Locations under a tenant. |
group | Groups under a location. |
device | Device records. |
policy | Policy definitions. |
script | Script library entries. |
job | Job library entries. |
sensor | Sensor definitions. |
custom_field | Custom field definitions. |
file | File Server entries. |
notification | Notification channel configurations. |
automation | Automation rules. |
system_setting | System-wide settings. |
patch | Patch approval records. |
audit_log | The Audit log itself (see Immutability below). |
Immutability
There is no delete affordance on the Audit page. You cannot remove individual entries, bulk-delete, or clear the log from the UI. The log is treated as append-only.
Viewing the Audit log is itself audited. When you open the page, an entry is written with action = view and entity_type = audit_log, recording which user accessed the log and from what IP. This means the auditors can be audited — you can see who has been reading the log.
Retention
Retention is not configurable on the Audit page. The date-range picker filters what you see; it does not delete anything. Retention is a global setting under Settings → Logging (see Appendix A.9).
Audit Details dialog
Clicking a row opens the Audit Details dialog. It shows the full record: date, severity, user, source IP, action, entity type, entity ID, entity name, tenant scope, and the formatted details payload. If the details field contains valid JSON, it is pretty-printed; otherwise it is rendered as plain text. The dialog has a single Close button.
Permissions
| Flag | Gates |
|---|---|
audit_enabled | Opening the Audit page. |
12.4 Cross-reference: which Phase-2 feature lands where
A single console action often produces records in both logs. The table below maps common operations to the records they write — use it when you are tracking a change across systems.
| Action | Events record | Audit record |
|---|---|---|
| Automation causes a device to change policy | — (no event; see the device detail's Assigned policy field) | update on policy — see Chapter 5 |
| Patch approval state change (Pending → Approved) | — | update on patch — see Chapter 7 |
| Policy edit saved | — | update on policy — see Chapter 6 |
| Software deployment executed | One job event per device with the install outcome | execute on job |
| Script run from the console | One job event per device with the run output | execute on script — see Chapter 8.1 |
| Permission flag or role changed on a user | — | update on user_permissions |
| Login success | — | login on session |
| Login failure | — | login_failed on session |
| Automation created | — | create on automation |
| Automation edited | — | update on automation |
| System setting changed | — | update on system_setting |
| Device authorised from the Unauthorized Devices page | — | authorize on device |
| Device deauthorised | — | deauthorize on device |
| Antivirus detection on a device | One antivirus event | — |
| Application Control or Device Control blocks an item on a device | One event under the antivirus type, Reported by = Application Control [...] / Device Control [...] (also on the Blocked tab — see 12.5) | — |
| Sensor threshold breached | One sensor event | — |
| Website uptime monitor fails / recovers | One Uptime Monitoring event | — |
| Port scan discovers a new open port | One Port Scanner event | — |
| Device comes online or goes offline | One uptime event (not in the Type dropdown) | — |
12.5 Application Control and Device Control blocks
When the agent blocks an unknown application or USB device, the block is surfaced in two places at once.
On the Events page. Each block is logged as an event. It shares the antivirus type with Microsoft Defender events, so the Type filter dropdown has no separate Application Control or Device Control entry — selecting antivirus, or leaving the filter on its default, includes them. Identify them by the Reported by column, which reads Application Control [<mode>] or Device Control [<mode>].
On a dedicated Blocked tab. The same block also lands on a block-and-approve tab inside Collections:
- Application Control blocks appear on the
Blocked Applicationstab ofManage Application Control Rulesets— see Chapter 8.6. - Device Control blocks appear on the
Blocked Devicestab ofManage Device Control— see Chapter 8.7.
The two surfaces serve different purposes. The Events entry is the operational timeline — what happened, when, and on which device. The Blocked tab is the workflow surface — a blocked attempt is an input to the approval process, where you decide whether to whitelist it. Use Events to spot a block; use the Blocked tab to act on it.
If the policy has tray-icon notifications enabled, the on-device user additionally sees a notification at the moment of the block — configured per policy in Chapter 6.
Permissions
| Flag | Gates |
|---|---|
events_enabled | Events page. |
audit_enabled | Audit page. |
See Appendix X.2 for the full permission catalogue.
Related chapters
- Chapter 5 — Automations explains why automation-driven policy changes show up as
updateonpolicyrather than as events. - Chapter 6 — Policies covers what a policy edit actually changes, producing the
updateonpolicyaudit entries referenced in 12.4. - Chapter 7 — Patch Management covers the approval workflow whose state changes surface as
updateonpatchentries. - Chapter 8 — Collections documents the Collections features whose executions appear as
job,sensor, andantivirusevents, and whose block logs live in their own tabs rather than in Events. - Chapter 13 — AI Chat is where the
Analyze with AIbutton on Event Details lands you. - Appendix A.9 — Logging & protocols covers the retention controls that determine how long events and audit entries are kept.
AI Chat
The AI Chat page at /ai-chat is a general-purpose AI assistant embedded in the console. You open it, type a question, and get an answer — the same mental model as any chat-style assistant. It is useful for quick lookups, explaining log output, drafting wording for a customer email, or sanity-checking a configuration choice before making it.
The feature depends on two switches being on. First, ai_enabled — a system-wide flag configured under Settings → AI/LLM, which also holds the provider, API key, and model. Second, ai_chat_page_enabled — a per-user permission that gates access to this page specifically. With ai_enabled off, the page shows the message "The AI provider has not been enabled. Ask your administrator to configure it under Settings → AI / LLM." and no conversation can be started. With ai_chat_page_enabled off, the page is not in the user's navigation menu.

13.1 The chat UI
The page is a two-column layout: the conversation sidebar on the left, and the active chat on the right.
Sidebar
The sidebar lists your past conversations. At the top:
New chat— starts a fresh conversation.- A search field with placeholder text
Search conversations...that filters the list by title.
Below, conversations are grouped by recency:
TodayYesterdayLast 7 daysLast 30 daysOlder
Each conversation shows its title, the time of its last update, and an optional context badge when the conversation was started from another part of the console (for example, when you launched the chat from the Analyze with AI button on an event).
Chat pane
The chat pane is the right column. It shows:
- A header strip with the AI avatar, the conversation title, the optional context badge, and
RenameandDeletecontrols. - The message area, with date dividers between different days.
- Chat bubbles: your messages right-aligned, the AI's responses left-aligned with the AI avatar.
- Markdown rendering for AI responses — code blocks, numbered and bulleted lists, tables, links, and blockquotes render as you would expect.
- A typing indicator while a response is being generated.
- Streaming updates as each chunk of the response arrives, so the answer appears incrementally rather than all at once.
Composer
At the bottom of the chat pane:
- A file attachment control, labelled
Attach text-based files (max 10 MB each). - The message textfield, with placeholder
Type your message...normally andAI is responding...while a response is streaming. - A send button that swaps into a stop button while streaming. Pressing stop cancels the current response.
13.2 Conversations
Creating a conversation
Clicking New chat creates an empty conversation with an auto-generated title. The title is derived in this order:
- From the first message text, trimmed to a short string.
- From the first attachment name, if the first action is attaching a file.
- From the literal
New Conversation, if neither of the above applies.
You can rename a conversation at any time from the Rename button in the chat pane header.
Renaming a conversation
The Rename Conversation dialog accepts a new title in a single text field. Submit to save; the new title appears immediately in the sidebar list.
Deleting a conversation
The Delete Conversation dialog asks for confirmation. Deletion is permanent — the conversation and all its messages are removed. Titled Delete conversation, the dialog is a one-click confirmation.
Exporting a conversation
There is no export affordance on the AI Chat page. If you need a record of a conversation, copy the content out of the browser by hand.
13.3 Attachments
The composer accepts text-based files, prepended to the outgoing message so the AI receives both your prompt and the file contents in one pass.

Allowed types and limits
- File types — text-based only. A whitelist of 40+ extensions covers the common cases: plain text, Markdown, source files across the major languages, YAML, JSON, XML, INI, CSV, logs, and configuration formats. Binary formats are not accepted.
- File size — 10 MB maximum per file.
- Files per message — up to 10 files can be attached to a single message.
How content is included
When you send, the content of each attached file is prepended to your message with markers so the AI can tell where each file starts and ends:
--- Attached file: {name} ({size}) ---
{file contents here}
--- End of {name} ---
The full content is sent — there is no truncation within the 10 MB per-file limit. Very large prompts may run into the provider's own token limit; the response will surface an error if that happens.
Attachment View dialog
Click an attachment chip in an existing message to open the Attachment View dialog, which shows the file name, a size label, and the full content as it was sent. Use this to verify exactly what was passed to the AI.
13.4 What AI Chat is not
A few points that come up often enough to call out explicitly, so readers coming from related parts of the product don't spend time looking for things that aren't there.
It is not the Scripts editor's AI Assistant
The AI Assistant button inside the Scripts editor (see Chapter 8.1 — Scripts) is a separate integration. It lives inside the Add Script and Edit Script dialogs, has its own inline panel, and is wired to write directly into the script editor. It is not the AI Chat page opened in a side panel.
The AI Chat page does not have a "Save as Script", "Save as Job", or "Save as Sensor" button. It cannot push a conversation into the Collections library. If you want to save a script the AI drafted, copy its code from the conversation, open the Scripts library, and paste it into a new script manually.
The same applies to the AI Assistant buttons on the Automations dialogs, the Widget Editor's AI SQL Assistant, and the Analyze with AI button on event and audit details — each of these is a targeted integration at its page, not the AI Chat page.
It does not show provider or model
The chat UI does not display the configured provider name, model name, or parameters to the end user. These live in Settings → AI/LLM (see Appendix A.11) and are only visible to users with access to that Settings page.
If you need to know which model is answering you, ask the administrator, or ask the model — it will usually tell you.
It does not integrate with Collections
The AI Chat page is general-purpose. It does not know about your Scripts, Jobs, Sensors, Custom Fields, App Hub entries, Application Control rulesets, or Device Control entries. It cannot look up a device, assign a policy, or trigger a deployment. For those interactions, use the relevant console page directly.
It does not export conversations
Already noted above — no export, no download, no shareable link. Treat conversations as transient.
13.5 Dialogs
| Dialog | Purpose |
|---|---|
| Rename Conversation | Change the title of the active conversation. |
| Delete Conversation | Confirm permanent deletion of the active conversation. |
| Attachment View | Inspect the full content of an attachment in an existing message. |
13.6 End-user AI Chat (tray)
Separate from the operator AI Chat page, NetLock RMM can give end users their own AI assistant directly from the agent's tray icon. It is opt-in per policy and is aimed at letting staff use AI sovereignly and under your control, rather than pasting company data into an external chatbot.
How it works:
- Opened from the tray. When enabled in the tray-icon policy, users open the chat from the agent's system-tray icon — no separate app, browser, or portal.
- End-to-end encrypted. Each user registers with a username (an email address by default) and a password. Conversations are encrypted on the device with a key derived from that password; the server stores only ciphertext it cannot read, and operators never see message content. A forgotten password makes that user's history permanently unrecoverable — by design (true zero-knowledge).
- Relayed through your provider. Requests travel tray → agent → server → the configured AI provider (or managed NetLock AI) and are streamed back the same path. The provider and model are the deployment-wide
Settings → AI/LLMsettings; see A.11. - Account control. New accounts are created inactive and must be activated by an operator — or a tenant can be set to auto-activate new accounts. Password rules and a required terms/privacy-acceptance step are configured per policy.
- Token limits. Each account has an optional monthly token limit, and each tenant has an optional monthly cap that applies on top: when the tenant cap is reached, all of that tenant's users are blocked until the monthly reset, even if an individual user still has budget. Usage is shown as a percentage and can be reset per account.
Operators manage these accounts from the Customer AI dialog, reached from the Tenants list (all accounts the operator may see) and from a tenant's detail page (that tenant only, where the per-tenant cap and auto-activation are set). The dialog shows email, tenant, active state, token usage/limit, reset date, and per-period statistics — never conversation content, which the server cannot decrypt. Access is gated by the enduser_ai_accounts permission and scoped to the operator's tenants.
The tray chat's title, labels, buttons, and messages — and the username/email requirement — are fully configurable per policy. See Chapter 6 — Policies for the tray-icon AI Chat settings.
Permissions
| Flag | Gates |
|---|---|
ai_enabled | System-wide AI feature toggle. When off, the chat page shows the disabled message regardless of per-user flags. Configured under Settings → AI/LLM. |
ai_chat_page_enabled | Per-user access to the AI Chat page. Users without this flag do not see the page in their navigation. |
enduser_ai_accounts | The Customer AI dialog for managing end-user AI chat accounts — activation, per-user and per-tenant token limits, auto-activation, and statistics. Tenant-scoped. |
See Appendix X.2 for the full permission catalogue.
Related chapters
- Chapter 8.1 — Scripts covers the Scripts editor's
AI Assistant— the integration that does write into a Script. - Chapter 12.2 — Events covers the
Analyze with AIbutton on the Event Details dialog, which opens AI Chat with the event pre-filled. - Appendix A.11 — AI / LLM configuration covers the provider, key, and model settings that back the chat.
Users & Roles
The Users page at /users is where console user accounts are created, edited, and deleted. User accounts are the identities that sign in to the console — not the agents, not the devices, not the customers. One account per technician.
NetLock RMM's access model is per-user permissions, scoped to tenants. There is no separate Roles page and no role templates to assign — control is exercised through a permission matrix on each user account. Read this chapter before spending time looking for role management elsewhere; the access model is explicit, flat, and per-user, and understanding it up front saves confusion later.

14.1 The Users list
The Users list shows one row per user account.
| Column | Meaning |
|---|---|
Username | The account's login identifier. |
Role | The free-text role label chosen when the account was created. |
Mail Address | The account's email, for notifications and password-reset delivery. |
Phone | Optional contact number. |
Last Login | Timestamp of the user's most recent successful login. |
IP Address | Source IP of the most recent login. |
2FA | Activated or Deactivated. |
Toolbar actions include Add User, Manage (open the selected user's settings), and Export Data to JSON or HTML.
Double-clicking a row, or using the Manage action, opens the user's settings page — covered in 14.3.
14.2 Creating a user
Add User opens the Add User dialog.

Fields:
Name— required. This is the username the user will log in with.Password— auto-generated, 12 characters, read-only in the dialog. The dialog also exposes aCopy to Clipboardbutton that copies both the username and password in one action, so you can paste them into your password manager or the credential-delivery workflow of your choice.Role— a dropdown. In the current release this dropdown contains onlyAdministrator; the value is stored as a free-text label on the user row and does not by itself grant or deny any permissions (see 14.4).Auth Mode—Password,SSO, orPassword & SSO. Chooses how the user signs in.Password— local password only.SSO— single sign-on only; local password is unused.Password & SSO— either mechanism works.
Submitting the dialog creates the account. The password is stored hashed (BCrypt) — never in plain text — and the new account is flagged for mandatory password change on first login. When the user first signs in, the console forces them to pick a new password before anything else.
Tip: Keep the dialog open until you have captured the generated password. Once the dialog closes, there is no way to retrieve that initial password from the UI. If you miss it, use the Reset Password flow (14.6) to generate a new one.
14.3 The user settings page
User Settings at /user_settings is the full editor for a single user. It is reached from the Users list via double-click or the Manage button.

The page is divided into sections:
- Account details — username, email, phone, role label, and authentication mode.
- Permissions — the matrix described in 14.4.
- Tenant scope — the table described in 14.5.
- 2FA — the switches described in 14.6.
- Actions — the
Reset PasswordandDeleteaffordances described in 14.6 and 14.8.
A Save button at the top or bottom of the page commits every edit on the page in one step; unsaved changes are kept in the browser until you save or navigate away.
14.4 Roles and permissions
There is no separate Roles page in NetLock RMM. The Role column on the Users list, and the Role dropdown on the Add User dialog, hold a free-text label attached to the user. The label does not map to a predefined permission set — it is descriptive.
All actual access control is exercised through the permission matrix on User Settings, per user, one account at a time. There are no role templates to clone, no bulk "assign this role to these users" affordance, and no inherited role layers. If you want ten technicians to have the same permissions, you configure ten accounts.
The switch-plus-checkbox pattern
The permission matrix is a set of sections, each introduced by a parent switch. The parent switch turns the whole section on or off. Inside each section, a set of child checkboxes gives finer-grained control over the affordances within. When the parent switch is off, its child checkboxes are disabled — even if their values are set, they have no effect until the parent switch is back on.
This pattern is consistent across the matrix: a user who cannot open a page at all does not need the child checkboxes under that page enabled; but if you are later going to grant page access, the child values are preserved and come back to life when the parent switch flips on.
The sections
The top-level sections in the matrix, in the order they appear:
- Devices — access to the Devices list, and per-tab / per-tool child checkboxes covering
General,Software,Task Manager,Antivirus,Events,Updates,Remote Shell,Remote File Browser,Remote Control,Remote EventLog Viewer,Remote Registry Editor,SNMP Tools,Shutdown,Reboot,Wake On LAN,Force Sync,Deauthorize, andMove. - Tenants — create / manage / edit / delete for tenants, plus analogous children for Locations and Groups.
- Automations — add / edit / delete for automation rules. See Chapter 5.
- Policies — add / manage / edit / delete for policies. See Chapter 6.
- Patch Management — access to the
/patch-managementpage. See Chapter 7. - Collections — a section per sub-feature:
Antivirus Controlled Folder Access,Application Control,Device Control,Sensors,Scripts,Jobs,Custom Fields,App Hub,Software Deployment, andFile Server. Each has its own child checkboxes for add / edit / manage / delete as applicable. See Chapter 8. - Relay Server — access to the Relay Server page and the manage / add / edit / delete children.
- Website Uptime Monitoring — page access.
- Port Scanner — page access.
- Events — page access.
- Audit — page access.
- Users — the Users list plus add / manage / edit / delete children.
- Reports — page access plus
Create,Edit,Delete,Generate,Schedules, andBrand Templateschildren. - Tickets — optional module; add / edit / delete / assign plus the manage-section children (departments, templates, SLAs, and so on).
- AI —
AI Chatpage access. See Chapter 13. - Settings — sub-sections for every settings page. Notifications have per-channel children (Mail, Microsoft Teams, Telegram, ntfy.sh, Webhook) with add / test / edit / delete; System, Maintenance, Updates, Database, Remote Screen, IP Whitelist, SSO, Whitelabeling, Globalization, Custom Fields, Dashboards, Reports, and AI/LLM all have their own section flags.
Every checkbox in the matrix corresponds to exactly one permission flag in the product. The flag names are the strings used throughout this documentation — devices_remote_shell, policies_edit, collections_scripts_add, reports_generate, and so on. See Appendix X.2 for the complete list.
How to approach the matrix
A practical pattern: start with the parent switches off, then turn on the sections the user needs access to and tick the children. For a read-only observer, grant the parent _enabled switches and leave the add / edit / delete children off; for a hands-on operator, grant the same switches and tick the children they need to act.
Don't try to represent a role as a stored object — represent it as a checklist you apply when provisioning each account.
14.5 Tenant scoping
Below the permission matrix is the Tenants table. It lists every tenant you have access to, with one checkbox per row. Ticking a tenant grants this user access to the devices, policies, events, and everything else scoped under that tenant.

Columns on the Tenants table: Name, Description, Author, Date, and Company.
The selection is stored as a list of tenant identifiers on the user account. A user with tenants A and B ticked will see devices, events, policies, jobs, and so on belonging to A and B; everything in tenant C is invisible to that user, regardless of whether their permission matrix grants devices_authorized_enabled or similar page access.
Permissions and tenant scope compound. To see devices in tenant A, a user needs both the devices_authorized_enabled flag (permission to open the Devices page) and tenant A ticked in the scope table (permission to see anything in that tenant).
14.6 Two-factor authentication and password reset
2FA switches
Two switches under the 2FA section of User Settings:
Two Factor Enabled— turns 2FA on for this user. With this switch on, the user is prompted for a second factor on every login.Two Factor Remote Actions— a second, narrower switch that requires 2FA specifically for sensitive remote operations (remote shell, remote file browser, remote control, remote registry editor, and similar). Disabled whenTwo Factor Enabledis off — you cannot require 2FA on remote actions while the user has no second factor at all.
When Two Factor Enabled is first toggled on, the user is walked through 2FA enrolment on their next login.
Reset Password
A Reset Password button under the Actions section generates a one-time password for the user. The dialog shows the new password in a read-only field, with a Copy to Clipboard button for handoff, and sets the account back into mandatory-password-change state so the user must pick a fresh password on their next login.
Use this when a user has lost their credentials, or after the initial Add User dialog's generated password was not captured.
Warning: The one-time password is visible on screen only once. Close the dialog and there is no way to retrieve it again — you would have to run Reset Password a second time.
14.7 What the Users page does not do
Two commonly-expected features are not implemented in the current release. If you are looking for them, stop looking.
- No impersonation. There is no "log in as this user" affordance. To test what another user sees, sign in as them directly (using a password you reset for that purpose) or set up a dedicated test account with the permission shape you want to evaluate.
- No password policy configuration. The password length generated on account creation and on reset is fixed at 12 characters. There is no UI for minimum length, complexity rules, rotation interval, or password history.
If either of these gaps is important to your operational model, flag it to NetLock — they are product gaps, not configuration problems to be solved locally.
14.8 Deleting a user
The Delete button on User Settings opens the Delete User confirmation dialog. Deletion is:
- Hard — the account is removed from the accounts table, not soft-deleted or disabled. There is no recycle bin, no undo, no reactivate.
- Cascading to AI Chat — the user's AI Chat conversations and their messages are also deleted.
- Audited — an audit entry is written with
action = deleteandentity_type = user, including the deleted user's identifier and the admin who performed the deletion. See Chapter 12.3.
After deletion the console redirects back to the Users list.
Events, sessions, logins, and actions previously performed by the deleted user remain in the Audit log — the deletion removes the account, not the trail of what the account did.
14.9 Dialogs
| Dialog | Purpose |
|---|---|
| Add User | Create a new user account with an auto-generated password. |
| Reset Password | Generate a one-time password for an existing user. |
| Delete User | Confirm hard deletion of a user account. |
| Export Data | Export the Users list to JSON or HTML. |
Permissions
| Flag | Gates |
|---|---|
users_enabled | Opening the Users page. |
users_add | The Add User dialog. |
users_manage | Opening a user's settings page. |
users_edit | Saving changes on a user's settings page. |
users_delete | Deleting a user. |
Access to the 2FA switches and the Reset Password button is gated by users_edit — they are edits on the user's record.
See Appendix X.2 for the full permission catalogue, including the flags referenced in the matrix throughout 14.4.
Related chapters
- Chapter 5 — Automations, Chapter 6 — Policies, and Chapter 8 — Collections cover the per-feature permission flags that appear under their respective sections in the matrix.
- Chapter 12.3 — Audit documents the audit trail written by every create / edit / delete on user accounts.
- Chapter 13 — AI Chat covers the
ai_chat_page_enabledflag that appears under the AI section of the matrix, and the effect of deleting a user on their AI Chat conversations. - Appendix A.4 — Security: IP whitelist & SSO covers the SSO configuration that the
Auth Modefield on Add User depends on. - Appendix X.2 — Permission reference is the complete catalogue of the flags exposed in the permission matrix.
Community
15.1 What Community means in NetLock RMM
Community is an integration layer rather than a place. It is not a standalone section in the Console navigation — there is no Community entry between Reports and Management, and no shared-intel dashboard. Instead, three feature areas each embed a small Community surface that talks to the same Members Portal: a Scripts catalogue, a Reports catalogue, and a Themes catalogue. This chapter is a short index of where each lives.
15.2 Where to find each community feature
| Feature | Where it lives | Full reference |
|---|---|---|
| Community Scripts | Scripts library (Collections) | Chapter 8.1 |
| Community Reports | Reports module | Chapter 11.9 |
| Community Themes | Whitelabeling settings | Chapter A.6 |
Each surface offers the same four actions against its own catalogue: browse, import into your local library, publish a local item back to the community, and report an abusive or broken entry.
15.3 How community authentication works
Community features authenticate at the deployment level. The administrator stores a single Members Portal API key in the Console's settings, and every user of that deployment inherits that identity when they click a community action. End users do not sign into a separate Members Portal account, and there is no per-user community login. The Publish and Import buttons embedded in the Scripts, Reports, and Whitelabeling pages therefore work for any user who holds the parent feature's own permission flag — for example collections_scripts_enabled for Community Scripts — and become inert when the deployment has no API key configured.
15.4 A note on the Virus Defense Easter egg
The route /community/events/retro renders a small retro tower-defense game called Virus Defense. It is an Easter egg, not a product feature, and has no permission check. You can disable it in the whitelabel section.
Related chapters
- Chapter 8.1 — Scripts — Community Scripts browser, publish, and report flows.
- Chapter 11.9 — Community Reports — Community Reports browser and publish flow.
- Chapter A.6 — Whitelabeling & themes — Community Themes browser, import, and publish flow.
Approve and label a new device
After an agent is installed it reports in to the Console but does not appear in the main Devices list. It sits in Unauthorized Devices until an administrator explicitly approves it. This guide covers the approval step and the follow-up of giving the device a readable label. The prerequisite is a successful agent install — if the agent has not yet reported in, see Guide H.1 first.

Before you start
- One or more agents have registered and are visible at
/unauthorized_devices. - You know which tenant, location, and group the device should end up in.
- Required permissions:
devices_enabledplus the role flag that gates the approval action on theUnauthorized Devicespage, anddevices_edit_label(or the equivalent in your deployment) to rename the device afterwards.
Steps
- In the Console, open
Devices → Unauthorized Devices. - Find the new entry. Each row shows the device's hostname, operating system, and the tenant, location, and group the agent was configured against.
- Confirm the row is correct. If the agent was configured for the wrong group, adjust the target group on the row before approving.
- Select the row and click
Approve Selected(or the single-row approve affordance). The entry disappears from the pending queue and the device appears in the mainDeviceslist with status beginning to report in real time. - Find the new device in the
Deviceslist. The default label matches the hostname (for exampleMARKETING-LAPTOP-01). - Open the Edit Label dialog for the device and replace the machine name with something meaningful —
Anna's laptop,Warehouse POS 3,Reception desk. Save.
Tip: Labels appear everywhere in the Console — the event feed, reports, the world map, the dashboard. A minute spent labelling each device pays off every time someone reads a report.
Verify it worked
- The device is no longer in
Unauthorized Devices. - The device appears in
Deviceswith an online status indicator. - The device's detail view shows the new label in the header and the correct tenant / location / group assignment.
- If an automation already routes a policy to the device's group, the detail view shows
Assigned policy: <name>within the device's next sync interval.
Troubleshooting
- The entry does not appear in
Unauthorized Devices. The agent may not have reached the server yet — wait a minute and refresh. If it still does not appear, check the agent's service is running on the device and review Troubleshooting. - The entry reappears after approval. Another agent is registering against the same identity, or the same installer was run twice on the device. Inspect
Eventsfor the device to see each contact attempt. - Approved but no policy lands. Policy attachment runs through Automations, not through approval. Create or verify an automation whose condition matches the device's new group — see Guide H.4.
Related
- Chapter 3 — Managing Devices — full device inventory and approval-flow reference.
- Guide H.1 — Deploy your first agent — the prerequisite step.
- Guide H.4 — Build and apply a policy — the follow-up to get configuration flowing.
Brand the Console (logo, colours, theme)
Whitelabeling lets you replace the NetLock RMM branding with your own. This guide walks through uploading a logo, tweaking a small set of palette colours, setting the browser-tab title, and optionally exporting the whole theme as a JSON file so you can reuse or share it.
Important product rules — read first.
- Whitelabeling is deployment-wide, not per-tenant. All authenticated users see the same branding.
- The logo is shared between light and dark modes — there is no separate dark-mode upload.
- Colours have two palettes — 20 fields in light mode and 20 in dark mode, 40 fields total — and both are always defined.
- Most changes apply immediately after saving; the login-page palette may need a hard refresh.

Before you start
- A logo file in PNG or JPG, recommended 200 × 50 px, no larger than 2 MB.
- The hex values you want for at least the
Primary,Secondary, andAppBar Backgroundcolours. - Required permissions:
settings_enabled,settings_whitelabeling_enabled.
Steps
1. Upload the logo
- Open
Settings → Whitelabeling(route/settings/whitelabeling). - Scroll to
Web Console Logo. - Drag and drop your logo file onto the uploader, or use the file picker. Accepted formats: PNG, JPG. Max: 2 MB.
- The preview updates in place. The same logo is used in both light and dark modes.
2. Set the Web Console Title
- Find the
Web Console Titletext input. - Replace
NetLock RMMwith your own title. The value appears in the browser tab and in the authenticated header.
3. Pick two or three palette colours
- Scroll to the colour-palette section. Two identical blocks are present — one for light mode and one for dark mode, each with twenty fields.
- Set at least these three in each palette for a coherent look:
Primary— the dominant brand colour.AppBar Background— the top bar colour.Text Primary— default body-text colour; make sure it contrasts well withBackground.
- Use the colour-picker widget next to each field, or paste a hex value directly (for example
#FF0000). - Make the same three choices (or their dark-mode equivalents) in the dark-mode block.
Tip: If you only set light-mode values, users on dark mode see the stock dark palette. Both palettes are always defined; the mode toggle just picks which one renders.
4. Save
Click the page's save action. An alert on the page states: Changes will be applied immediately after saving. The authenticated UI updates live. For colour changes the alert adds: The Login page may require a refresh to see the new colors. — reload the login page if you need to verify it there.
5. Optional — export the theme
- Click
Export Theme. The Console produces a versioned JSON file (for examplewhitelabeling-theme.json) containing the title, the logo, login-page settings, both palettes, AppBar settings, and footer links. - Save the JSON somewhere safe — it is the only backup of your theme.
Optional — community themes
The page also exposes a Community Themes browser, which lets you filter themes by category (Light Theme, Dark Theme, Corporate, MSP, Seasonal, Holiday, Other), preview them, and import one. Importing a community theme auto-downloads the current theme as a backup first.
Verify it worked
- The new logo is visible in the authenticated header of the Console.
- The new title is in the browser tab.
- The
Primary,AppBar Background, andText Primarycolours reflect on the UI in the current mode. - Toggling between light and dark in the theme mode selector applies each palette independently.
- The login page shows the new palette after a hard refresh (Ctrl+F5).
Troubleshooting
- Logo upload rejected. Confirm the format is PNG or JPG and the size is ≤ 2 MB.
- Login-page colours are stale. Browsers cache the login page aggressively. Clear the cache or hard-refresh.
- Wrong brand in some views. Whitelabeling has no per-tenant scope. If you manage multiple customers as an MSP, the Console always shows your own brand to authenticated users; separate per-customer login portals are not available from this page.
Related
- Appendix A.6 — Whitelabeling & themes — full reference, including the import dialog, particle and fun-fact options, footer links, and community publish flow.
Build and apply a policy
Applying configuration to a device in NetLock RMM is a two-stage task. First you build a policy that describes what should be enforced. Then you create an automation — a condition → policy rule — that routes the policy to the devices that should receive it. Policies are never attached to groups, locations, or devices directly; there is no "Apply Policy" button anywhere in the Console. The two stages are always distinct, and this guide walks through both.
At the end you will have one device running one policy, with evidence of the assignment in the device detail view and in Events.

Before you start
- At least one tenant, location, and group exists (see Guide H.3).
- At least one authorised device is online in a group you intend to target (see Guide H.1 and Guide H.2).
- Required permissions:
policies_enabled,policies_add(or equivalent),automation_enabled, andautomation_add.
Note: A device receives at most one policy at a time. Policies do not layer, merge, or inherit. If two automations match the same device, the higher-priority rule wins.
Stage 1 — Build the policy
- Open
Policiesfrom the navigation. - On
Manage Policies, clickAdd. In the Add Policy dialog enter aName(for exampleStarter Workstations) and an optionalDescription. Save. - Click
Manageon the new row to open the Policy Settings editor. - Step through the tabs you care about and tune settings. For a first pass the defaults on the
Agenttab are usually fine — they set the sync interval and remote-control capabilities. See the full tab reference in Chapter 6 for everything you can configure. - Save.
Warning: Policies have no templates, no versioning, and no rollback. Edits apply in place. Before making risky changes to an in-use policy, duplicate it first from the
Manage Policiespage and edit the copy.
Stage 2 — Route the policy with an automation
- Open
Automationsfrom the navigation. - Click
Add. In the Add Automation dialog fill in:NameandDescription.Condition— pickGroupfor the simplest case.Expected result— enter the exact group name this policy should apply to (for exampleWorkstations).- Target policy — pick the policy you created in stage 1.
- Save.
The server immediately re-evaluates every connected device against the updated automation list and pushes matching policies. You do not need to wait for the next scheduled poll.
Tip: Automations are evaluated in priority order and the first match wins. If you have multiple rules that could match the same device, reorder them on the
Manage Automationspage so specific rules sit above general ones.
Verify it worked
- Open
Devicesand select a device in the target group. Its detail view showsAssigned policy: <your policy name>. - Open
Eventsand filter by the device. Look for entries that mark the policy deployment and any follow-on actions triggered by the policy. - Optionally open
Auditfor an immutable record of when and by whom the policy was created and the automation added.
Troubleshooting
- Device shows
no_assigned_policy_found. No automation matched the device. Re-check the automation's condition and expected value — an exact string match against the device's group is required. - Wrong policy is assigned. Another automation higher in the priority order matched first. Reorder or narrow the higher rule.
- Policy saved but no events appear. Confirm the device is online in
Devices. A device that is offline picks up the policy on its next sync. For persistent offline devices, see Troubleshooting.
Related
- Chapter 5 — Automations — the policy-routing layer, the seven condition types, and priority resolution.
- Chapter 6 — Policies — complete reference for every tab in the Policy Settings editor.
- Guide H.5 — Configure Windows Defender via policy — a worked example of tuning the Windows tab.
Configure email and Microsoft Teams notifications
Notifications in NetLock RMM fan out from a single page — Settings → Notifications — to multiple channels. This guide walks through the two most common: email via SMTP and Microsoft Teams via an incoming webhook. You will configure the global SMTP server, add one email recipient, add one Teams connector, and run the built-in test for each.

Before you start
- You have SMTP server credentials for your environment, and you can receive mail at a test address.
- For Teams, you have an incoming webhook URL for a Teams channel. Create one in Teams via the channel's connector configuration.
- Required permissions:
settings_enabled,settings_notifications_enabled.
Email — Steps
1. Configure the global SMTP server
- Open
Settings → Notifications(route/manage_notifications). - On the tab labelled
E mail, clickSMTP settingsto open the SMTP settings dialog. - Fill in:
Server— SMTP hostname.Port— SMTP port.SSL/TLS— tick if the server requires TLS.Username— SMTP authentication username. If this is not a valid email address, the dialog reveals extra fields.Password— SMTP password.From address— if shown, the sender address the server will accept.To address— if shown, a test-recipient address.
- Click
Test. The Console sends a message with subjectNetLock - Test Alertand bodyTest successful.. A snackbar reportsTest successful.on pass orTest failed: <error>on failure. - Save. The dialog's save action is gated behind a successful test — you cannot persist a configuration that has not been tested.
Note: Only one SMTP configuration exists per deployment. Editing it replaces the previous configuration for every email recipient.
2. Add an email recipient
- Back on the
E mailtab, clickAddto open the Add Mail Notification dialog. - Fill in:
E mail— the recipient address.Description— optional free text.Severity—Any,Critical,High,Moderate, orLow. Events not matching the chosen severity are filtered out for this recipient.Uptime Monitoring— on if this recipient should also receive disconnection alerts when uptime monitoring is enabled on a device.- Tenant scope — drag the tenants this recipient should receive events from out of the
Tenantslist and intoSelected tenants.
- Save. The row appears in the recipients table.
Microsoft Teams — Steps
1. Add a Teams connector
- On the same page, switch to the
Microsoft Teamstab. - Click
Addto open the Add Microsoft Teams Notification dialog. - Fill in:
Connector Name— a recognisable name for this channel.Connector-Webhook-URL— the incoming webhook URL from Teams. The value is masked once saved.Description— optional free text.Severity— same five options as email.Uptime Monitoring— same behaviour as email.- Tenant scope — drag tenants into
Selected tenants.
- Save.
2. Test the connector
- On the new row in the Microsoft Teams table, click the row's
Testaction. - The Console POSTs a small JSON payload to the webhook. A snackbar reports
Successfully senton pass orFailed sending: <error>on failure. - Open the Teams channel the webhook is bound to and confirm the test message arrived.
Verify it worked
- An email arrived at your test address with the subject
NetLock - Test Alert. - The Teams channel received a message starting with
NetLock RMM Alert: Test. - The recipient rows on both tabs show the severity, tenant scope, and uptime-monitoring values you set.
Troubleshooting
- SMTP test fails with authentication errors. Re-check username, password, and whether your SMTP provider requires an app password or OAuth. For providers that allow only specific sender addresses, fill in
From addressto match. - Teams test succeeds but no message arrives. Confirm the webhook URL is still enabled in Teams and the channel has not been archived.
- Events do not trigger emails after setup. Severity filtering is on the recipient record. An event below the recipient's severity threshold is silently filtered; lower the threshold temporarily to verify.
- No messages for a specific tenant. Tenant scope on the recipient record acts as a filter. Add the missing tenant to
Selected tenantsor leave the scope empty to receive events from all tenants.
Related
- Appendix A.8 — Notifications deep dive — the other channels (Telegram, ntfy.sh, Webhook) and per-channel configuration details.
- Chapter 6.6.2 — Antivirus notifications sub-tab — per-policy event selection that feeds these channels.
Configure Windows Defender via policy
Microsoft Defender Antivirus settings for managed Windows devices live inside a policy, under the Windows tab. This guide shows the shape of a minimal Defender setup: enable the feature, add one exclusion, and schedule a weekly scan. The Defender surface is much broader than these three steps — see Chapter 6.6 for the full reference including every scanner toggle, all eight notification categories, and the complete exclusion-type list.

Before you start
- A policy already exists (see Guide H.4).
- An automation already routes the policy to at least one Windows device, or you will add one after saving.
- Required permission:
policies_enabledand the role flag that gates policy editing in your deployment.
Steps
Enable Defender on the policy
- Open
Policiesfrom the navigation. - On
Manage Policies, clickManageon the policy you want to edit. - Open the
Windowstab, thenMicrosoft Defender Antivirus, thenConfiguration. - Tick the master
Enabledcheckbox at the top of the panel. Without this, none of the settings below are applied to devices.
Add an exclusion
- In the Configuration sub-tab, scroll to the
Exclusionssection. - Click
Addto open the Add Exclusion dialog. - Pick a
Type— one ofFile,Directory,File Type (extension), orProcess. - Enter the
Exclusionvalue for that type (for example a directory path likeC:\Program Files\VendorApp). - Add an optional
Descriptionso future admins know why the exclusion exists. - Save. The new entry appears in the Exclusions table.
Schedule a weekly scan
- Still on the Configuration sub-tab, scroll to the
Scan Jobssection. - Click
Addto open the Add Scan Job dialog. - Fill in:
Enabled— on.NameandDescription— for exampleWeekly full scan.Schedule Type— pick a day-of-week schedule.- Day toggles — tick one day (for example Sunday).
Time— pick an off-hours time.Scan Mode— pick the mode that fits (quick versus full).- Set the
CPU Usage %cap, and theScan on Battery,Network Drives,Removable Disks, andUpdate Signaturestoggles to your preference.
- Save. The scan-job row appears in the table.
- Use the Add Scan Job Directory dialog from inside the scan-job editor to add the directory list the scan covers. Most deployments want the full system drive.
Save and let the automation route it
Save the policy. Devices that receive this policy through an automation apply the Defender configuration on their next sync. If no automation routes the policy yet, create one — see Guide H.4 stage 2.
Verify it worked
- On the policy's detail view, the
Windows → Microsoft Defender Antivirus → Configurationsub-tab shows theEnabledcheckbox ticked, the exclusion in the table, and the scan job in the schedule table. - In
Events, filter by a targeted device and look for entries reflecting the Defender configuration push. - Locally on the device, Windows Security shows Defender active, the new exclusion listed under
Virus & threat protection settings → Exclusions, and a scheduled task entry corresponding to the scan job.
Troubleshooting
- No Defender changes on the device. Confirm the device is assigned the right policy (
Devices → <device> → detail view → Assigned policy). If the field saysno_assigned_policy_found, create or fix an automation. - Scan never runs. Open the scan job in the policy and confirm
Enabledis on, the day toggle matches today's plan, and the time has not already passed for this week. - Exclusion is ignored. Defender exclusions are case-sensitive on some paths. Re-check the value in the exclusion row against the actual path on the device.
Related
- Chapter 6.6 — Microsoft Defender Antivirus — the complete reference for the Defender sub-section.
- Guide H.4 — Build and apply a policy — how to route this policy to the right devices.
- Chapter 5 — Automations — the policy-routing layer.
Create your first tenant, location, and group
NetLock RMM organises every device into a three-level hierarchy: tenant → location → group. A device cannot be approved into the console without one of each. This guide walks through creating the hierarchy from scratch, either manually or through the first-run Setup Wizard. Once finished you will have an empty tree ready to receive an agent.

Before you start
- You are signed in to the Console as a user with permission to manage tenants.
- Required permissions:
tenants_enabledfor the Manage Tenants page, plus the role flags that gate add-tenant, add-location, and add-group actions in your deployment.
Steps
Create the tenant
- In the navigation, open
Tenants. - On the
Manage Tenantspage, click the add affordance. - Fill in the tenant name and any required metadata. For an in-house IT team the tenant usually maps to the company; for an MSP it maps to one customer.
- Save. The new tenant appears in the list and is empty — no locations, no groups, no devices yet.
Create the location
- Select the new tenant in the list to enter its detail view.
- Open
Location Settingsfor the tenant. - Use the add-location affordance and enter a location name. Locations typically reflect a physical site —
Berlin HQ,Remote Workers,Datacenter A. - Save.
Create the group
- Inside
Location Settings, open the newly created location. - Use the add-group affordance.
- Enter a group name aligned to how the devices inside it will be configured —
Workstations,Laptops,Servers,POS Terminals. A good rule of thumb is "one group per intended policy". - Save.
Tip: If a single policy applies to every device at a location regardless of role, one group per location is plenty. Only split groups when different policies will apply. It is easier to add groups later than to consolidate them.
Alternative — the Setup Wizard
On a fresh deployment, the Setup Wizard dialog opens the first time an administrator visits the Dashboard and runs through the same three steps as a single flow. If the wizard is still on screen, follow its prompts instead of navigating manually; the result is identical.
Verify it worked
Manage Tenantslists the new tenant.Location Settingsfor that tenant lists the new location.- Opening the location shows the new group in its group list.
Troubleshooting
- Add affordances are disabled. Your user account is missing one of the management permissions. Ask an administrator to grant
tenants_enabledand the relevant add flags. - The location or group fields reject a name. Names are typically unique per parent — a second
Workstationsgroup inside the same location is rejected. Rename or pick a different parent.
Related
- Chapter 4 — Tenants, Locations & Groups — full reference, including tenant settings, per-tenant exports, and hierarchy reorganisation.
- Guide H.1 — Deploy your first agent — installs an agent into the new hierarchy.
- Guide H.4 — Build and apply a policy — routes a policy to the new group.
Deploy custom applications with scripts
Winget, Chocolatey, and Flathub cover the common catalogue apps, but plenty of software is not in any of them: an internal line-of-business tool, a vendor MSI behind a download URL, a .deb from a private repository, a macOS .pkg. For those, App Hub has a Script source: you write the install (and optionally update, uninstall, and detection) commands yourself, and Software Deployment runs them on the target devices in the agent's context.
This guide covers the whole flow: creating a script-based app in App Hub, writing an install script that reports success or failure correctly, adding an optional detection script so already-installed devices are skipped, deploying the app, and reading the per-device results.
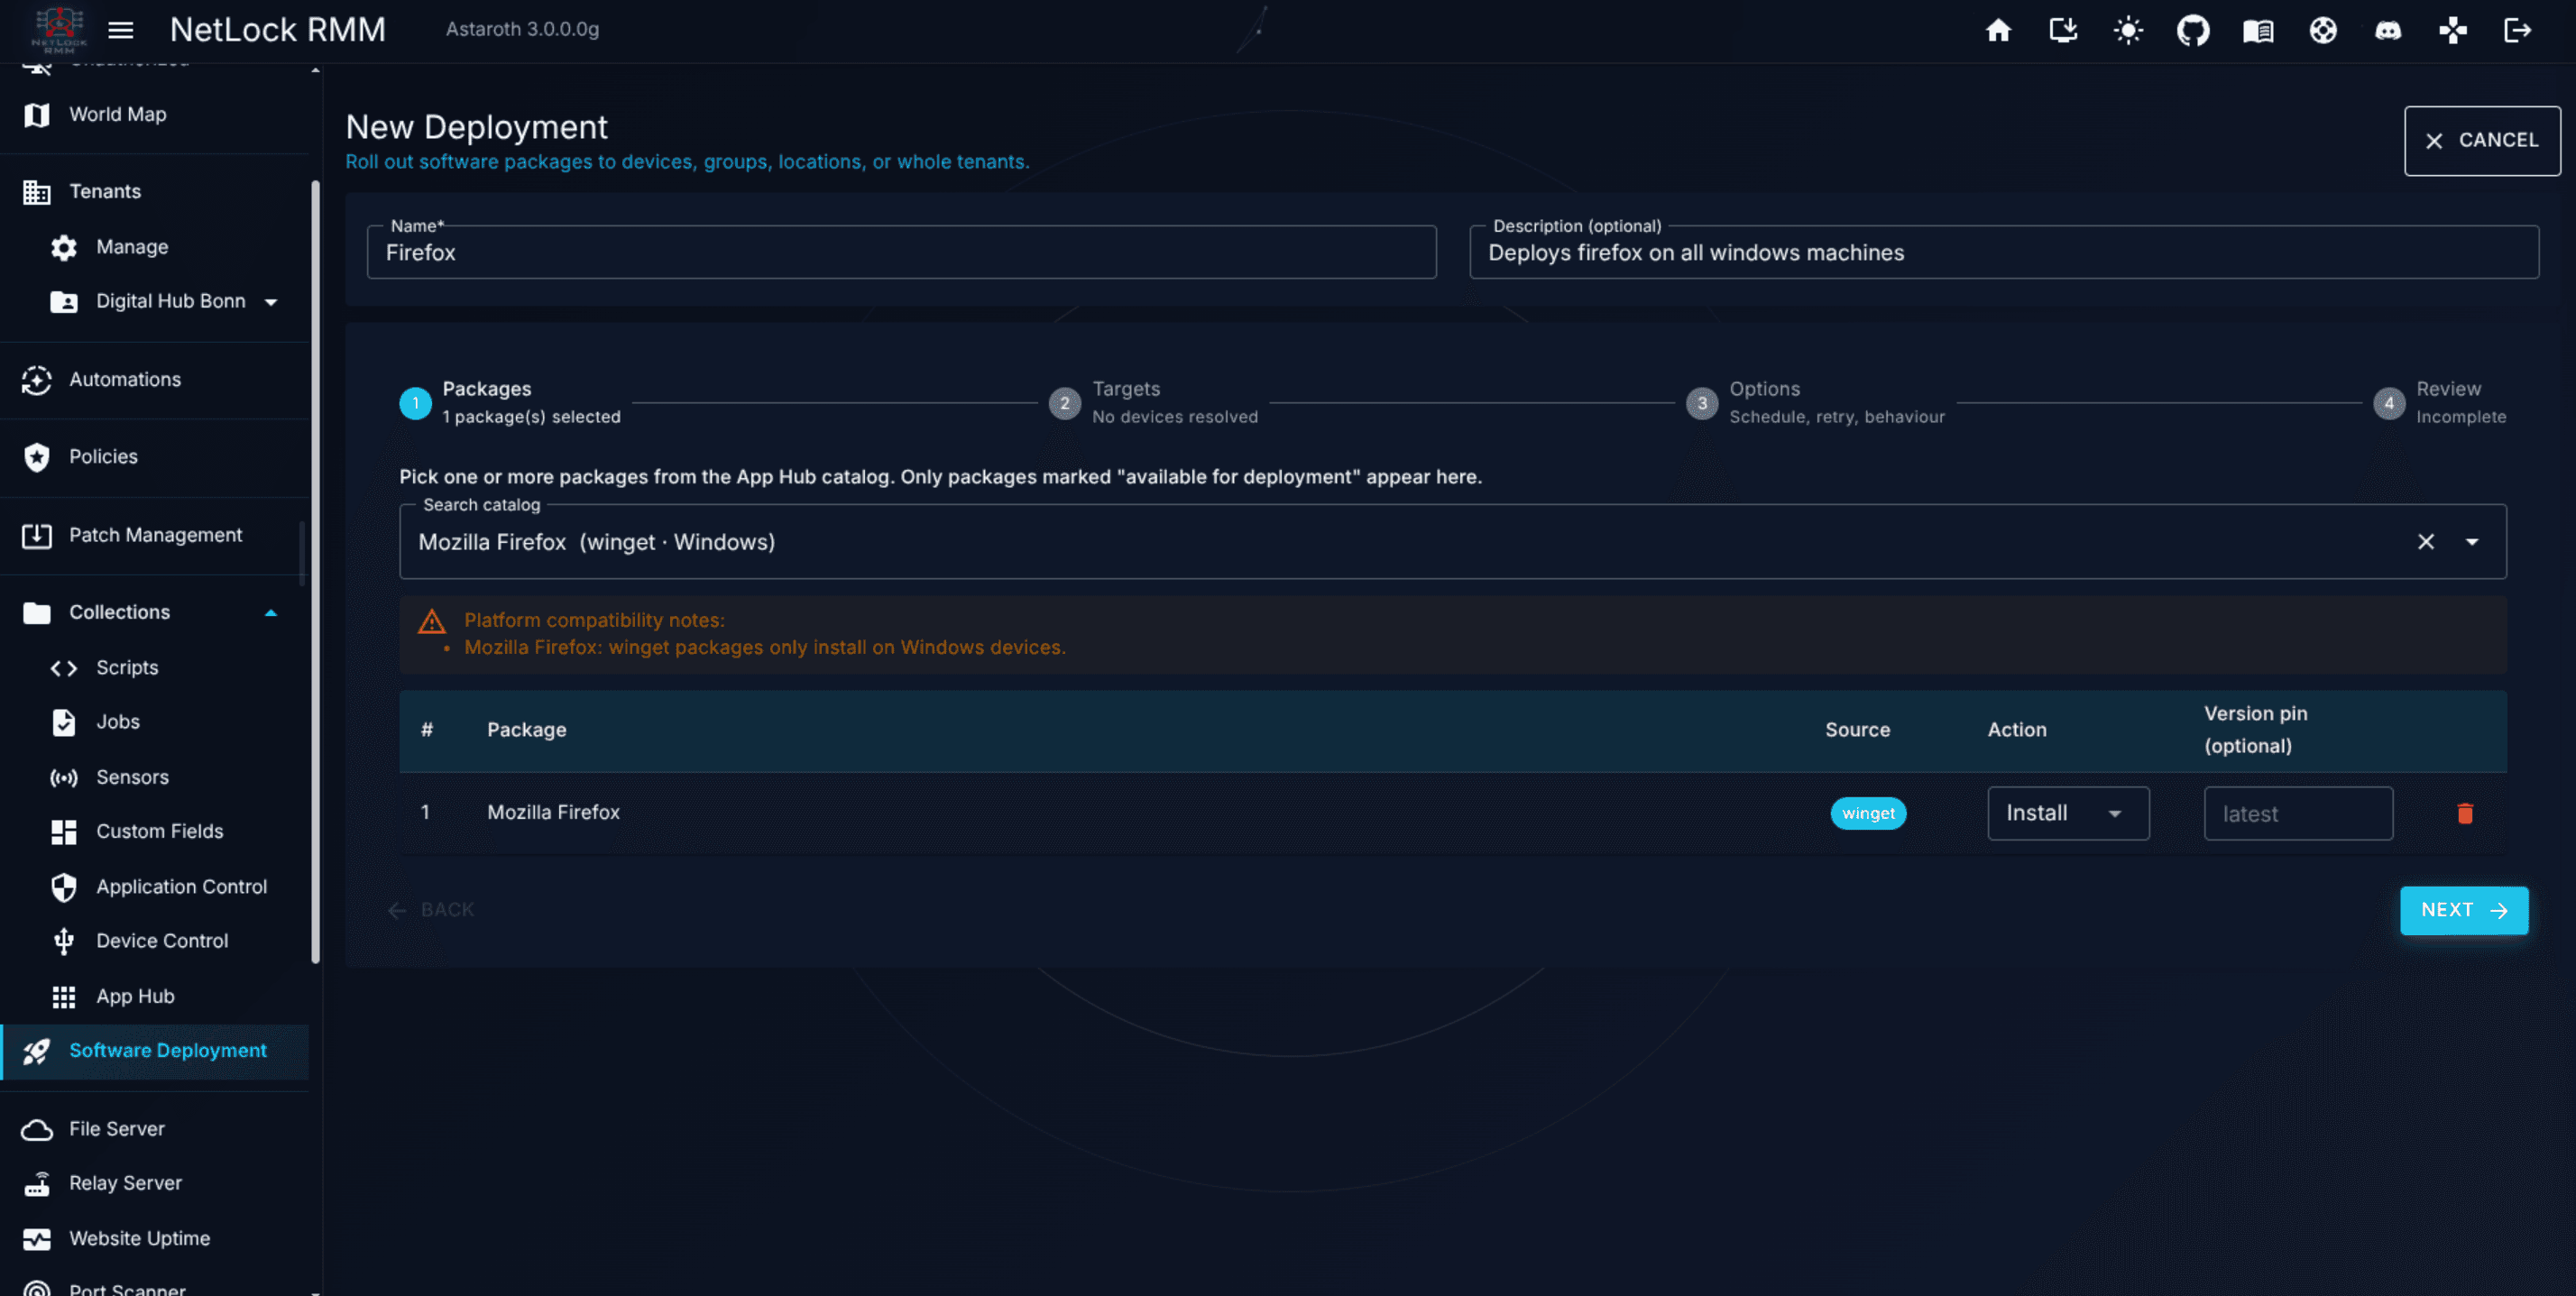
Before you start
- Required permissions:
collections_enabled,collections_app_hub_enabledto create the app; pluscollections_software_deployment_enabledandcollections_software_deployment_addfor the deployment. - Target devices are online and assigned a policy.
- You know the silent-install command line for your software (for example an MSI's
/qnswitches, an installer's/S,apt-get install -y, orinstaller -pkg). - The install and detection scripts run as the agent —
SYSTEMon Windows,rooton Linux and macOS. There is no interactive user, so every command must be fully non-interactive.
Create the application
- Open
Collections → App Hub(route/app_hub_manage_apps). - Click
Addto open the Add Manual App dialog. - Fill in the shared metadata:
Name(required) — how the app appears in the catalogue and the deployment wizard.Description,Version,Publisher,Author,License,Homepage— optional metadata.- An icon upload (
.png,.ico,.jpg/.jpeg, up to 256 KB).
- Under Source, choose
Script. (The other sources —Winget (Windows),Chocolatey (Windows),Flatpak (Linux)— are package-manager entries and do not take scripts.) - Pick the
Script Shellthat matches the platform you are targeting:PowerShellfor Windows,Bashfor Linux,Zshfor macOS. This sets the editor language and the shell your scripts run in. - Fill in the script editors:
Install Script(required) — the commands that install the software.Update Script— run when a deployment item uses theupdateaction.Uninstall Script— run when a deployment item uses theuninstallaction.Detection Script(optional) — decides whether the app is already installed; see The detection script.
- Set
Target OStoWindows,Linux, ormacOS. Keep this consistent with theScript Shell— the install script runs in that platform's native shell (PowerShell on Windows, Bash on Linux, Zsh on macOS). - Leave
Requires Elevationon so the install runs asSYSTEM/root. (Turning it off routes Windows installs to the user session through the Tray Icon; see the note in The detection script.) - Optionally set
Tagsas a JSON array, e.g.["dev","cli"]. - Click
Confirm. The app appears in the App Hub list with thescriptsource chip.
The Edit App dialog exposes the same fields against an existing entry.
The install script
The install script is the heart of a script-based app. A few rules govern how it runs and how its result is judged:
- Context. It runs as the agent —
SYSTEMon Windows,rooton Linux/macOS — with no interactive desktop. Use silent/quiet installer switches and absolute paths. - Shell. Windows scripts run through PowerShell, Linux through Bash, macOS through Zsh.
- Timeout. The install script has a 30-minute timeout. If it exceeds that, the agent kills it and the item is reported as failed.
- Success rule. This is the important one: a script install is marked failed only when its captured output starts with the text
Error(case-insensitive). Exit codes are not evaluated, and a thrown exception or output on stderr alone does not mark it failed. If the script produces no output beginning withError, the item is reported assuccess— even if the underlying installer returned a non-zero exit code.
Because of the success rule, you must make your script emit a line beginning with Error: on every failure path — check the installer's exit code (or catch the exception) and write the error to standard output yourself. A bare throw or exit 1 is not enough on its own.
PowerShell:
$ErrorActionPreference = 'Stop'
try {
    $p = Start-Process msiexec.exe -ArgumentList '/i', 'C:\path\to\app.msi', '/qn', '/norestart' -Wait -PassThru
    if ($p.ExitCode -ne 0) { Write-Output "Error: msiexec exited $($p.ExitCode)"; exit 1 }
    Write-Output "MyApp installed."
}
catch {
    Write-Output "Error: $($_.Exception.Message)"
    exit 1
}
Bash / Zsh:
if ! apt-get install -y ./app.deb; then
    echo "Error: apt-get install failed"
    exit 1
fi
echo "MyApp installed."
Write idempotent scripts. The same install script can run more than once on a device — for example when detection is absent, or when a deployment uses Force reinstall. Write the script so that running it on a machine that already has the app is harmless: check before you act, use installer switches that repair or upgrade in place, and avoid steps that fail when a previous run already completed them.
The detection script
A detection script answers one question before an install runs: is this application already installed on the device? If it is, NetLock RMM skips the install and reports the device as Skipped instead of reinstalling. This is the same idea as an Intune detection rule — a small script that returns "present" or "absent" — but written as a shell snippet you control. It is optional; without it, every deployment install runs the installer unconditionally.
The rules are fixed and identical across every source type and platform:
- The detection script runs on the device, before every install — never for
updateoruninstall. - It runs in the same shell as the install script: PowerShell on Windows, Bash on Linux, Zsh on macOS.
- It runs in the agent's context (SYSTEM on Windows, root on Linux/macOS), with a 5-minute timeout.
- Exit code 0 AND at least one non-whitespace character on stdout → installed. The install is skipped and the job item is reported as
Skipped(which counts as a success, not a failure). - Any other result → not installed. A non-zero exit code, or exit code 0 with no output, runs the install normally.
- A detection crash or timeout is treated as "not installed" (fail-open): the install proceeds, and the failure is logged and noted in the result output.
- An empty detection script means the install always runs.
- Force reinstall on a deployment bypasses detection entirely — the installer always runs.
v1 limitation: Windows apps configured with "Requires elevation" turned off run in the user session through the Tray Icon and do not run detection. Their installs always proceed.
Note that detection and install use different success rules. Detection cares about the exit code plus stdout (0 + output = installed); the install cares about whether its output starts with Error. Keep that in mind when reusing snippets between the two editors.
Deploy the application
App Hub is only the catalogue — installing the app on devices happens through Software Deployment.
- Open
Collections → Software Deployment(route/software_deployment) and start aNew Deployment. - Step 1 — Packages. Select your script app and choose the
installaction. (updateruns the Update Script;uninstallruns the Uninstall Script.) - Step 2 — Targets. Pick the devices, groups, locations, or tenants that should receive it. Keep the Target step aligned with the app's
Target OS— a Windows PowerShell app will fail on Linux devices. - Step 3 — Config. Set the mode, schedule, retries, and flags. Leave
Force reinstalloff to let detection skip already-installed devices; turn it on to reinstall everywhere (this bypasses detection entirely, so no device is reported asSkipped). - Step 4 — Review. Confirm and submit.
For a fuller walkthrough of the wizard, see Deploy software with App Hub.
Read the results
Open the deployment's detail page. The per-device results table shows an outcome chip per device:
success(green) — the install script ran and did not emit output starting withError.failed(red) — the install script's output started withError, or it timed out.Skipped(blue) — the detection script reported the app as already installed, so the install did not run. This counts as a success.
Click into a device to open the per-device results dialog. Per attempt it shows the exit code, duration, timestamps, an error summary, and the stdout tail / stderr tail. For a skipped device the stdout tail carries a [detection] note explaining that the app was already installed. This is the primary forensic view when something goes wrong.
Complete examples
Each example is an install-and-detection pair for one platform.
Windows (PowerShell) — MSI install + file-path detection:
# Install Script
$ErrorActionPreference = 'Stop'
try {
    $installer = "$env:TEMP\myapp.msi"
    Invoke-WebRequest -Uri 'https://example.com/myapp.msi' -OutFile $installer -UseBasicParsing
    $p = Start-Process msiexec.exe -ArgumentList '/i', "`"$installer`"", '/qn', '/norestart' -Wait -PassThru
    if ($p.ExitCode -ne 0) { Write-Output "Error: msiexec exited $($p.ExitCode)"; exit 1 }
    Write-Output "MyApp installed."
}
catch {
    Write-Output "Error: $($_.Exception.Message)"
    exit 1
}
# Detection Script
if (Test-Path 'C:\Program Files\MyApp\MyApp.exe') { Write-Output 'installed'; exit 0 } else { exit 1 }Linux (Bash) — .deb install + command detection:
# Install Script
tmp="$(mktemp --suffix=.deb)"
if ! curl -fsSL -o "$tmp" 'https://example.com/myapp.deb'; then
    echo "Error: download failed"
    exit 1
fi
if ! apt-get install -y "$tmp"; then
    echo "Error: apt-get install failed"
    exit 1
fi
echo "MyApp installed."
# Detection Script
command -v myapp >/dev/null 2>&1 && echo installed && exit 0
exit 1macOS (Zsh) — pkg install + app-bundle detection:
# Install Script
tmp="$(mktemp -d)/myapp.pkg"
if ! curl -fsSL -o "$tmp" 'https://example.com/myapp.pkg'; then
    echo "Error: download failed"
    exit 1
fi
if ! installer -pkg "$tmp" -target /; then
    echo "Error: installer failed"
    exit 1
fi
echo "MyApp installed."
# Detection Script
[ -d '/Applications/MyApp.app' ] && echo installed && exit 0
exit 1Troubleshooting
- The deployment reports
success, but the app did not install. A script install is marked failed only when its standard output starts withError. A non-zero exit code, a thrown exception, or a message on stderr does not mark it failed on its own. Add explicit failure handling that writes a line beginning withError:to standard output on every failure path — see The install script. - The app always installs, even where it is already present. Detection reported "not installed". Check that the detection script exits
0and prints at least one non-whitespace line when the app is present — exit0with no output counts as "not installed". Also confirmForce reinstallis off. On Windows user-context apps ("Requires elevation" off), detection never runs by design. - The app is always skipped, even on clean devices. Your detection script is exiting
0with output on machines that do not have the app. Tighten the check (a specific file path or a specific registryDisplayName) so it only succeeds when the app is truly present. - Detection errored (crash or timeout). The install proceeded anyway (fail-open) and the per-device
stdout tailcarries a[detection] script failednote. Detection has a hard 5-minute timeout — keep the script fast and avoid network calls. - The install script is killed mid-run. The install script has a 30-minute timeout. If your installer legitimately needs longer, break the work up or pre-stage large downloads.
- Windows user-context installs never skip. This is the v1 limitation: apps with "Requires elevation" off run through the Tray Icon in the user session, which does not run detection. Mark the app as requiring elevation if you need detection and the installer can run as
SYSTEM.
Related
- Chapter 8.5 — App Hub — the catalogue, manual and browser-based entries, and the script fields.
- Chapter 8.8 — Software Deployment — the deployment reference, including the per-device result detail and the
Force reinstallflag. - Deploy software with App Hub — deploying a Winget catalogue app end to end.
- Guide H.7 — Write, test, and schedule a PowerShell script — for one-off scripts that are not packaged as App Hub apps.
Deploy software with App Hub (Winget)
App Hub is a catalogue; it does not install software by itself. To actually roll an app out to devices you combine two Collections features: App Hub supplies the package definition, and Software Deployment wraps that definition in a deployment job with targets, scheduling, and per-device result tracking. This guide walks through picking a Winget app into App Hub and rolling it out to a small group with the Software Deployment wizard.

Before you start
- Target devices are online and assigned a policy.
- For Winget apps, target devices are Windows and have Winget available (Windows 10 1809+ or Windows 11).
- Required permissions:
collections_enabled,collections_app_hub_enabledand one of the browser flags (collections_app_hub_browse_wingetfor Winget); pluscollections_software_deployment_enabledandcollections_software_deployment_addfor the deployment.
Steps
Add a Winget app to App Hub
- Open
Collections → App Hub(route/app_hub_manage_apps). - Either click
Refresh catalogsfirst to sync the remote catalogues, or use the Winget Catalog Browser directly. - Open the Winget Catalog Browser, search for the app you want (for example
7zip.7zip), select it, and clickAdd to Catalog. The app appears in the App Hub list with thewingetsource chip, publisher, and version.
Alternatively, click Add on App Hub to open the manual-entry dialog, pick Winget as the source, and paste the Winget Package ID and Winget Source directly.
Create a deployment
-
Open
Collections → Software Deployment(route/software_deployment). -
Click the add affordance to open
New Deployment— a four-step wizard. -
Step 1 — Packages. Search for the app you added and select it. Choose
installfrom the per-item action dropdown. Only apps flaggedavailable_for_deploymentare selectable. -
Step 2 — Targets. Pick devices, groups, locations, or tenants. Enable the dynamic-membership option if you want devices added to the target group after submission to be picked up automatically.
-
Step 3 — Config. Choose a
Mode:interactive— the deployment runs in the foreground with real-time feedback.bulk— the deployment runs as a background job.
Set the start time, expiry, retry settings (
retry_max,retry_backoff_min), and the abort-on-first-failure and force-reinstall flags as needed. -
Step 4 — Review. Confirm the summary and submit. The deployment is now on the Software Deployment list.
Note: Software Deployment is not policy-driven. A deployment targets devices directly through its own wizard. The App Hub tab inside the Policy Settings editor is unrelated — it only curates which apps appear in the tray icon.
Verify it worked
- The deployment shows on
/software_deploymentwith a progress indicator (succeeded/failed of target_count) that ticks up as devices report results. - The deployment's detail page shows four info cards (Status, Progress, Author & Created, Scheduled / Expires) and a per-device result table.
- Clicking into a device on the detail page opens the per-attempt details: exit code, duration, stdout / stderr tails, and any error summary.
- On a successfully targeted device, the application is installed and reported under the device's inventory.
Troubleshooting
- App not selectable in the wizard. App entries must have
available_for_deploymentenabled. Edit the App Hub entry and confirm the flag. - Some devices fail. Open the deployment detail page and review the per-device result. The stderr tail and exit code usually identify the cause (Winget source unavailable, package ID incorrect, insufficient disk space).
- Install fails with an elevation or permissions error. An installer runs in a specific user context, and whether it needs administrative elevation is declared by the package maintainer — not by NetLock RMM. The App Hub entry carries an elevation setting (whether the installer requires elevation) that reflects what the maintainer specified. Maintainers occasionally specify this incorrectly: an installer that actually needs elevation is marked as not requiring it, or the reverse. The installer then runs in the wrong context and reports
installation failed. When the exit code or stderr points to a permissions or elevation problem, edit the App Hub entry and test the opposite elevation setting before assuming the package itself is broken. - Non-Windows devices reported failure. Winget is Windows-only. Narrow the Target step to Windows devices or use a Flatpak or Chocolatey app definition for other platforms.
- Retry the failed devices. Click
Retryon the deployment detail page. Retry respectsretry_maxandretry_backoff_minand increments the per-device attempt counter.
Related
- Chapter 8.5 — App Hub — the catalogue, manual and browser-based entries, and
Refresh catalogs. - Chapter 8.8 — Software Deployment — the full deployment reference, including the detail page and ad-hoc single-device deployments.
- Deploy custom applications with scripts — package software not in Winget/Chocolatey/Flathub as a script-based App Hub app, with install and detection scripts.
- Guide H.7 — Write, test, and schedule a PowerShell script — an alternative for manual install scripts.
Deploy your first agent
This guide takes you from a clean device to a running NetLock RMM agent that has reported in for the first time. It covers only the installer build and the installation itself. The follow-up — approving the pending device and giving it a label — is in Guide H.2. For an end-to-end walk-through with tenant creation and policy assignment, see the First-Run Walkthrough.

Before you start
- A tenant, location, and group already exist to receive the agent. If they don't, do Guide H.3 first.
- You have administrator or root access on the target device.
- The target device can reach the Console's communication and remote servers over the network.
- Required permission:
devices_enabled, plus whatever your deployment uses to open the Agent Download dialog (typically exposed alongside theDevicesmenu).
Steps
- In the Console, open
Devicesfrom the navigation and launch the Agent Download dialog. On a fresh deployment the same dialog is available from the Setup Wizard on the Dashboard. - Work through the five-step wizard:
- Configuration name — a label for this installer build.
- Deployment method — pick the target tenant, location, and group.
- Target server — select the communication, remote, update, trust, file, and relay servers the agent will talk to.
- Authorization — choose whether the agent is pre-authorized or lands in the pending queue for admin approval. For a first agent, pending approval is safer.
- Platform and architecture — choose one of
win-x64,win-arm64,linux-x64,linux-arm64,osx-x64,osx-arm64. Pick either theStandard Installer(console, silent-capable) or theGUI Installer(graphical).
- Click the build action. The Console packages a binary with the embedded configuration into a
.zipand returns a download link. - Optionally download the matching install script —
Install-NetLockAgent.ps1for Windows,Install-NetLockAgent.shfor Linux or macOS — if you prefer a scripted install over running the binary directly. - Copy the
.zipto the target device and run the installer with the commands below.
Windows (PowerShell, elevated):
Expand-Archive .\NetLockAgent.zip -DestinationPath .\NetLockAgent
.\NetLockAgent\NetLock_RMM_Agent_Installer.exe
For silent deployment via GPO, Intune, or Ansible, add flags:
.\NetLock_RMM_Agent_Installer.exe --hidden --no-log--hidden/-h— hide the console window (Windows only).--no-log/--nolog— delete installer logs after completion.--temp <path>/-t <path>— use a custom temporary directory for the install.
Linux / macOS (Bash, with sudo):
unzip NetLockAgent.zip -d NetLockAgent
chmod +x NetLockAgent/NetLock_RMM_Agent_Installer
sudo ./NetLockAgent/NetLock_RMM_Agent_Installer
With no arguments the installer uses its embedded configuration. For manual re-configuration or repair it also accepts positional modes: clean "<path-to-server_config.json>" runs a fresh install with an external config, fix "<path>" repairs an existing install while preserving its server config, and uninstall removes the agent.
Warning: Treat agent installers like secrets. The server configuration is embedded inside the binary, so anyone with the
.zipcan register a new device into the configured group. Rotate the installer if it leaves trusted hands.
Verify it worked
- The installer reports success and exits without an error code.
- The agent is registered as a Windows service, a systemd unit on Linux, or a LaunchDaemon on macOS, and is running.
- Within a minute or two the device appears in the Console — in
Unauthorized Devices(pending approval), or inDevicesdirectly if you chose pre-authorization in step 4 of the wizard.
Troubleshooting
- Device never appears. Confirm the target device can reach the configured communication server from its network. A
curlorTest-NetConnectionagainst the server address from the device is the fastest check. See Troubleshooting for deeper diagnostics. - Installer fails with permission errors. Re-run as Administrator (Windows) or
sudo(Linux / macOS). The installer registers a service, which requires elevation on every supported OS. - The device appears in the wrong tenant or group. The Agent Download wizard embeds the targeting inside the binary. Rebuild the installer and re-run it with
clean "<new-server_config.json>"to reconfigure in place. - Installer fails on a Linux NAS or appliance distro. Some Linux distributions — notably those on NAS systems such as Synology — restrict or block execution from the default temporary directory. The installer cannot stage its files there and fails early. Re-run the installer with
--temp <path>/-t <path>pointing at a directory the system permits execution from (a path on a regular data volume, for example), then retry.
Related
- Guide H.2 — Approve and label a new device — the next step after the agent reports in.
- Uninstall an agent — cleanly remove the agent from a device when you're done.
- Chapter 3 — Managing Devices — full device inventory reference.
- First-Run Walkthrough — end-to-end tour that includes this guide.
Enable SSO with Azure AD / Google
NetLock RMM supports single sign-on via OpenID Connect. This guide covers the two most common providers — Azure AD and Google — as two short sub-flows on the same configuration page. Before you start, read the four caveats below: SSO is the only area in the product where saving a settings change restarts the Console, and there are a few product rules that differ from what other RMMs do.

Before you start — four things to know
- One provider at a time. Only one SSO provider can be enabled. Turning one on automatically turns the others off.
- Users must be pre-provisioned. SSO login does not auto-create accounts. Every SSO user must already exist in
UserswithAuth Modeset toSSOorPassword & SSO. The NetLock username must match the email claim the provider returns. - Saving restarts the Console. Confirming the save triggers an application restart and all active user sessions are terminated.
Required permissions for this guide: settings_enabled, settings_sso_enabled.
Pre-provision users first
- Open
Usersin the navigation. - For every user who should sign in via SSO, open or add their account.
- In the Add / Edit User dialog, set
Auth ModetoSSO(SSO only) orPassword & SSO(either method). Make sure the username matches the email address the identity provider will return as the email claim. For testing you might want to set it toPassword & SSOin case you have to troubleshoot the SSO login to prevent locking yourself out. - Save.
If you skip this step, every SSO sign-in attempt is rejected with User is not authorized for SSO login. Please contact your administrator..
Azure AD — Steps
1. Register an application in Azure AD
In the Azure portal, register a new application for NetLock RMM. When asked for a redirect URI, assemble it as https://<your-console-host>/<callback-path> — the Console does not display this URI for you to copy. For Azure AD, the default Callback Path is /signin-oidc, so the redirect URI is typically https://<your-console-host>/signin-oidc.
Record the following values from Azure:
- Tenant ID.
- Application (Client) ID.
- A new client secret.
2. Configure the Azure AD tab in NetLock
- Open
Settings → SSO(route/settings/sso). - Switch to the
Azure ADtab. - Toggle
Enable Azure ADon. The info alert on the page reminds you that enabling one provider disables the others. - Fill in the required fields:
Instance— for examplehttps://login.microsoftonline.com/.Domain— for exampleyour-domain.onmicrosoft.com.Tenant ID— from the Azure portal.Client ID— from the Azure portal.Client Secret— from the Azure portal.Callback Path— typically/signin-oidc.Signed Out Callback Path— typically/signout-callback-oidc.Response Type— typicallycode.Save Tokens— optional, enable if downstream flows need the provider tokens.
- Click
Save. - A confirmation dialog warns:
The web console will automatically restart after saving the SSO configuration. All active user sessions will be terminated. Do you want to continue?. Confirm. - The Console restarts. Wait a moment and sign back in — the SSO option should appear on the login page.
Google — Steps
1. Configure an OAuth 2.0 Client in Google Cloud
In Google Cloud Console, create an OAuth 2.0 Client ID of type Web application. Add an authorised redirect URI constructed as https://<your-console-host>/<callback-path> — for Google the default Callback Path is /signin-google, giving https://<your-console-host>/signin-google.
Record:
- Client ID.
- Client Secret.
If you want to restrict sign-in to a Google Workspace domain, note the domain name too.
2. Configure the Google tab in NetLock
- Open
Settings → SSO. - Switch to the
Googletab. - Toggle
Enable Googleon. - Fill in:
Client ID— for exampleyour-client-id.apps.googleusercontent.com.Client Secret— from Google Cloud.Callback Path— typically/signin-google.Signed Out Callback Path— typically/signout-callback-google.Hosted Domain (Optional)— the Workspace domain if you want to restrict sign-in, otherwise leave blank.Save Tokens— optional.
- Click
Save, confirm the restart warning, and wait for the Console to come back up.
Verify it worked
- The Console's login page shows the SSO option for the provider you enabled.
- Signing in as a pre-provisioned user with the correct email claim succeeds and lands them on the Console.
- A user whose
Auth ModeisPasswordonly is rejected with the authorisation error above — this confirms the provisioning rule is active.
Troubleshooting
- Save is blocked by a licence dialog. Apply a valid paid licence first. Community / trial modes do not permit saving SSO configuration.
- Red alert
SSO Configuration Error!on the page. The configuration failed to load on startup and SSO is disabled. Re-check all required fields on the active provider tab and re-save. - User sees
User is not authorized for SSO login.The account is missing, or itsAuth ModeisPasswordonly, or its username does not match the email claim. Fix inUsersand have them try again. - Redirect URI mismatch at the provider. The callback path you entered in NetLock must match the redirect URI you registered at the provider — path for path, including the leading
/.
Related
- Appendix A.4 — Security: IP whitelist & SSO — the full reference for all five supported OIDC providers, IP-whitelist interaction, and per-user
Auth Mode. - Chapter 14 — Users & Roles — pre-provisioning accounts and setting
Auth Mode.
Handle a ticket from open to resolved
Optional module: This guide assumes the Ticket System is enabled. See Chapter 10 to enable it.
This guide walks through the full loop for a single ticket: create it, triage and assign it, post an internal note, reply to the customer, log time, and close it out. The same steps apply to tickets that arrived via inbound email — only the starting point differs.

Before you start
- The Ticket System is enabled in
Settings → Ticket System. - At least one support department exists, with outbound SMTP configured if you want to reply to the customer by email.
- Required permissions:
tickets_enabled,tickets_create,tickets_edit,tickets_assign. Time-tracking entries additionally requiretickets_view_time_trackingon the entry-creator.
Steps
1. Open the Tickets page
Navigate to Tickets (route /tickets). Use the status tabs at the top (All, Open, In Progress, Waiting, Resolved, Closed) to narrow the view.
2. Create the ticket
- Click
New Ticket. The New Ticket dialog opens. - Fill in
Title(required),Department,Priority(defaults toMedium),Contact Email(the autocomplete searches existing contacts; new addresses are accepted), and an optionalDescription. If entered, the description becomes the first outbound comment in the Conversation tab. - Save. The ticket appears in the list with a generated ticket number and
Status = Open.
3. Open the ticket detail view
In the list, click the new row. The detail dialog opens with six tabs: Conversation, Details, Time Tracking, History, Attachments, and — when AI is configured — AI.
4. Triage on the Details tab
- Switch to the
Detailstab. - Set
Assigned To Operatorto yourself or the owning operator. This field is gated bytickets_assign. - Optionally set a
Type(for exampleIncident,Request) and add colour-codedLabelsfor reporting. Edits save in place and are logged in theHistorytab.
5. Post an internal triage note
- Switch back to the
Conversationtab. - On the composer at the bottom, toggle the direction to internal (the lock icon). Internal notes are never sent to the customer and render in orange.
- Write the note and send.
6. Reply to the customer
- Toggle the composer direction to outbound (the globe icon). Outbound messages are emailed to the contact using the department's SMTP settings.
- Optionally click the template-picker button to insert a saved response template.
- Pick
Rich Text,HTML, orPlain Textmode and send.
7. Log your time
- Switch to the
Time Trackingtab. - If the department has automatic time tracking enabled, the banner at the top shows the running timer — no action needed unless it has paused on idle.
- Otherwise, expand
Add Entryand fill inDate,Start Time,End Time, and optionalNotes.Durationis computed. Save.
8. Close the ticket
- Return to the
Detailstab. - Change
StatustoResolvedif you are waiting on customer confirmation, orClosedif no further reply is expected. - Setting
StatustoClosedopens the Close Ticket dialog; enter an optionalClosing Comment— it is stored as an internal note.
Verify it worked
- The
Historytab lists entries for the status change and the assignee change, each with old and new values. - The ticket now appears under the
Closedtab (orResolved). Closed rows render at reduced opacity. - The customer received the outbound reply at the
Contact Emailaddress. The internal note is not visible to them. - The
Time Trackingtab shows at least one entry and the summary footer reflects its duration.
Troubleshooting
- The customer never received the reply. Outbound replies use the department's SMTP settings, not the global notification SMTP. Verify the department's outbound SMTP configuration — see Chapter 10.
- The ticket is stuck in
Waiting. Any-to-any status transitions are allowed. Open theDetailstab and changeStatusdirectly.
Related
- Chapter 10 — Tickets — full reference for the ticket list, detail dialog, statistics, and departments.
- Chapter 14 — Users & Roles — managing the
tickets_*permission flags on operators. - How-to H.10 — Configure email and Microsoft Teams notifications — setting up outbound notification channels that complement ticket email.
Install the NetLock RMM server with Docker
Self-hosted only: This guide applies to self-hosted deployments. Cloud customers do not install the server — the hosted platform is run for them.
This guide covers installing the NetLock RMM server and Web Console with Docker. Both can run in the cloud or in an offline environment, depending on your requirements. Two methods are described: a guided installer that generates the setup for a standard server, and a manual Docker Compose setup for full control.
Network structure
Agents only make outgoing connections, so no port forwarding is required on the managed machines. The Web Console renders content server-side and sends it to the administrator's browser, so a persistent connection between the Web Console and the administrator is required during operation.
The Web Console communicates either directly with the SQL server or, for real-time features such as the remote shell and file browser, with the NetLock Remote Server over SignalR. Make sure the Web Console can reach the NetLock Remote Server.
Warning: The Web Console should only be reachable from trusted networks.
Guided installation
NetLock RMM can be deployed in any environment with Docker support, including setups behind Cloudflare tunnels and similar. The guided script builder targets typical server installations.
For help deploying NetLock RMM in non-standard environments, contact the support team.
Open the installation tool and follow its steps: https://netlockrmm.com/install
Manual installation
For full control, install the stack manually with Docker Compose.
Requirements
- The latest version of Docker.
- MySQL Server, version 8.0 or newer.
- 2 CPU cores — more may be needed depending on how many agents you monitor.
- 8 GB RAM.
Note: The 8 GB RAM requirement supports the high-performance, memory-optimised update delivery. With insufficient RAM the setup may fail, or NetLock RMM may run slowly because it falls back to swap space. The backend is efficient — 8 GB is sufficient for 2,000 or more devices.
The Docker images are published under the latest tag.
Warning: The database name, password, domains, time zone, and Members Portal API key in the templates below are examples. Replace every one of them with values for your own environment before deploying.
Web Console
Create a directory for the appsettings.json file:
mkdir -p /home/netlock/web_consoleCreate directories for Let's Encrypt, internal data, and logs:
mkdir -p /home/netlock/web_console/letsencrypt
mkdir -p /home/netlock/web_console/logs
mkdir -p /home/netlock/web_console/internal
Create the appsettings.json file:
nano /home/netlock/web_console/appsettings.jsonFill it in with your configuration:
{
  "Logging": {
    "LogLevel": {
      "Default": "Warning",
      "Microsoft": "Error",
      "Microsoft.Hosting.Lifetime": "Warning"
    },
    "Custom": {
      "Enabled": false
    }
  },
  "AllowedHosts": "*",
  "Kestrel": {
    "Endpoint": {
      "Http": {
        "Enabled": true,
        "Port": 80
      },
      "Https": {
        "Enabled": false,
        "Port": 443,
        "Force": false,
        "Hsts": {
          "Enabled": true
        },
        "Certificate": {
          "Path": "/certificates/certificate.pfx",
          "Password": ""
        }
      }
    },
    "IpWhitelist": [],
    "KnownProxies": ["172.18.0.2"]
  },
  "NetLock_Remote_Server": {
    "Server": "netlock-rmm-server",
    "Port": 7080,
    "UseSSL": false
  },
  "NetLock_File_Server": {
    "Server": "netlock-rmm-server",
    "Port": 7080,
    "UseSSL": false
  },
  "MySQL": {
    "Server": "mysql-container",
    "Port": 3306,
    "Database": "vwffyq",
    "User": "root",
    "Password": "frfsL9FGmQWGbZDM",
    "SslMode": "None",
    "AdditionalConnectionParameters": "AllowPublicKeyRetrieval=True;"
  },
  "Webinterface": {
    "Title": "NetLock RMM On Premises",
    "Language": "en-US",
    "Membership_Reminder": false,
    "PublicOverrideUrl": "https://nl-backend.penguin-monitoring.de"
  },
  "Members_Portal_Api": {
    "Enabled": true,
    "ApiKeyOverride": "YOUR-MEMBERS-PORTAL-API-KEY"
  }
}
Adjust the values to match your environment.
Server
Create a directory for the appsettings.json file:
mkdir -p /home/netlock/serverCreate directories for Let's Encrypt and logs:
mkdir -p /home/netlock/server/letsencrypt
mkdir -p /home/netlock/server/logs
Create the persistent files directory used by the file server:
mkdir -p /home/netlock/server/files
mkdir -p /home/netlock/server/internal
Create the appsettings.json file:
nano /home/netlock/server/appsettings.jsonFill it in with your configuration:
{
  "Logging": {
    "LogLevel": {
      "Default": "Warning",
      "Microsoft": "Error",
      "Microsoft.Hosting.Lifetime": "Warning",
      "Microsoft.AspNetCore.SignalR": "Error",
      "Microsoft.AspNetCore.Http.Connections": "Error"
    },
    "Custom": {
      "Enabled": false
    }
  },
  "AllowedHosts": "*",
  "Kestrel": {
    "Endpoint": {
      "Http": {
        "Enabled": true,
        "Port": 7080
      },
      "Https": {
        "Enabled": false,
        "Port": 7443,
        "Force": false,
        "Hsts": {
          "Enabled": true
        },
        "Certificate": {
          "Path": "/certificates/certificate.pfx",
          "Password": ""
        }
      }
    },
    "Roles": {
      "Comm": true,
      "Update": true,
      "Trust": true,
      "Remote": true,
      "Notification": true,
      "File": true,
      "LLM": true
    }
  },
  "MySQL": {
    "Server": "mysql-container",
    "Port": 3306,
    "Database": "vwffyq",
    "User": "root",
    "Password": "frfsL9FGmQWGbZDM",
    "SslMode": "None",
    "AdditionalConnectionParameters": "AllowPublicKeyRetrieval=True;"
  },
  "Members_Portal_Api": {
    "Enabled": true,
    "ApiKeyOverride": "YOUR-MEMBERS-PORTAL-API-KEY"
  },
  "Environment": {
    "Docker": true
  }
}
The Roles block decides which server roles this instance runs — see Server roles below.
Docker Compose
The following docker-compose.yml brings up Traefik (as a reverse proxy handling Let's Encrypt certificates), MySQL, the Web Console, and the server:
services:
  traefik:
    image: traefik:latest
    container_name: traefik
    command:
        - '--providers.docker=true'
        - '--providers.docker.exposedbydefault=false'
        - '--entrypoints.web.address=:80'
        - '--entrypoints.websecure.address=:443'
        - '--entrypoints.web.http.redirections.entryPoint.to=websecure'
        - '--entrypoints.web.http.redirections.entryPoint.scheme=https'
        - '--entrypoints.web.http.redirections.entryPoint.permanent=true'
        - '--certificatesresolvers.myresolver.acme.httpchallenge=true'
        - '--certificatesresolvers.myresolver.acme.httpchallenge.entrypoint=web'
        - '--certificatesresolvers.myresolver.acme.email=support@netlockrmm.com'
        - '--certificatesresolvers.myresolver.acme.storage=/certificates/acme.json'
    ports:
        - '80:80'
        - '443:443'
    volumes:
        - '/var/run/docker.sock:/var/run/docker.sock:ro'
        - '/home/netlock/certificates/traefik:/certificates'
    networks:
      netlock-network:
        ipv4_address: 172.18.0.2
    restart: always

  mysql:
    image: mysql:8.0
    container_name: mysql-container
    environment:
      MYSQL_ROOT_PASSWORD: "frfsL9FGmQWGbZDM"
      MYSQL_DATABASE: "vwffyq"
    volumes:
      - /home/netlock/mysql/data:/var/lib/mysql
      - /etc/localtime:/etc/localtime:ro
    networks:
      netlock-network:
        ipv4_address: 172.18.0.3
    restart: always
    command:
      - --skip-log-bin
      - --innodb_buffer_pool_size=1G
      - --innodb_log_file_size=256M
      - --innodb_flush_log_at_trx_commit=2
      - --max_connections=200

  netlock-rmm-web-console:
    image: nicomak101/netlock-rmm-web-console:latest
    container_name: netlock-rmm-web-console
    environment:
      - TZ=Europe/Berlin
    volumes:
      - '/home/netlock/web_console/appsettings.json:/app/appsettings.json'
      - '/home/netlock/web_console/internal:/app/internal'
      - '/home/netlock/web_console/logs:/var/0x101 Cyber Security/NetLock RMM/Web Console/'
      - '/home/netlock/certificates:/app/certificates'
      - /etc/localtime:/etc/localtime:ro
    labels:
      - 'traefik.enable=true'
      - "traefik.http.routers.webconsole.rule=Host(`nl-webconsole.penguin-monitoring.de`)"
      - 'traefik.http.routers.webconsole.entrypoints=websecure'
      - 'traefik.http.routers.webconsole.tls.certresolver=myresolver'
      - 'traefik.http.services.webconsole.loadbalancer.server.port=80'
      - "traefik.http.routers.webconsole-http.rule=Host(`nl-webconsole.penguin-monitoring.de`)"
      - 'traefik.http.routers.webconsole-http.entrypoints=web'
      - 'traefik.http.routers.webconsole-http.middlewares=redirect-to-https'
      - 'traefik.http.middlewares.redirect-to-https.redirectscheme.scheme=https'
    networks:
      netlock-network:
        ipv4_address: 172.18.0.4
    restart: always
    depends_on:
      - mysql

  netlock-rmm-server:
    image: nicomak101/netlock-rmm-server:latest
    container_name: netlock-rmm-server
    environment:
      - TZ=Europe/Berlin
    volumes:
      - '/home/netlock/server/appsettings.json:/app/appsettings.json'
      - '/home/netlock/server/internal:/app/internal'
      - '/home/netlock/server/files:/app/www/private/files'
      - '/home/netlock/server/logs:/var/0x101 Cyber Security/NetLock RMM/Server/'
      - '/home/netlock/certificates:/app/certificates'
      - /etc/localtime:/etc/localtime:ro
    labels:
      - 'traefik.enable=true'
      - "traefik.http.routers.rmmserver.rule=Host(`nl-backend.penguin-monitoring.de`)"
      - 'traefik.http.routers.rmmserver.entrypoints=websecure'
      - 'traefik.http.routers.rmmserver.tls.certresolver=myresolver'
      - 'traefik.http.services.rmmserver.loadbalancer.server.port=7080'
      - "traefik.http.routers.rmmserver-http.rule=Host(`nl-backend.penguin-monitoring.de`)"
      - 'traefik.http.routers.rmmserver-http.entrypoints=web'
      - 'traefik.http.routers.rmmserver-http.middlewares=redirect-to-https'
    networks:
      netlock-network:
        ipv4_address: 172.18.0.5
    restart: always
    depends_on:
      - mysql

networks:
  netlock-network:
    driver: bridge
    ipam:
      config:
        - subnet: 172.18.0.0/16
Troubleshooting
To view a container's logs, use:
docker logs <container-id>Server roles
The NetLock RMM server runs in seven roles. Each is toggled in the server's appsettings.json under the Roles block; a single instance can run all of them, or they can be split across multiple instances.
| Role | Purpose |
|---|---|
Comm | Handles communication with the comm agent — device information, policy, and event synchronisation. |
Update | Provides update packages for the agents — comm agent, health agent, remote agent, installer, and uninstaller. |
Trust | Provides the hashes of all update packages. Agents contact the trust role to verify the hash of a downloaded package. |
Remote | Handles real-time connections between agents and the Web Console, such as the remote shell and file browser. |
Notification | Sends third-party notifications — email, Microsoft Teams, Telegram, and ntfy.sh. |
File | Provides the file storage service for downloading and uploading files. |
LLM | Provides the AI language-model integration for the intelligent features. |
Advanced server concept
The Docker Compose setup above runs every component — the reverse proxy, MySQL, the Web Console, and the NetLock RMM server — on a single host. This is the recommended starting point and is sufficient for most deployments.
For larger fleets or specific infrastructure requirements, the three main components can instead run on separate servers: the MySQL database, the NetLock RMM server (the backend), and the Web Console.
The components communicate over the network, so nothing forces them onto the same machine. Each one is pointed at the others through its appsettings.json:
- The Web Console's
MySQLblock addresses the database server, and itsNetLock_Remote_ServerandNetLock_File_Serverblocks address the backend. - The server's
MySQLblock addresses the database server.
In the single-host Compose setup these settings use Docker container names (mysql-container, netlock-rmm-server) because every component shares one Docker network. In a distributed setup, you replace those with the hostnames or IP addresses of the separate servers.
Splitting the deployment this way lets you size and scale each component independently — for example, running MySQL on dedicated database infrastructure, or keeping the Web Console and the backend on separate hosts.
Related
- A.1 — System overview & licensing — the read-only system health and licence pages on a running deployment.
- Upgrade NetLock RMM — pulling new container images once the stack is running.
- Deploy your first agent — the next step once the server is up.
Monitor a device with SNMP
NetLock RMM can monitor an SNMP-capable device — a switch, firewall, NAS, UPS, printer, or access point — without installing an agent on it. Instead, an installed NetLock RMM agent on the same network polls the SNMP target on your behalf.
The chain has four parts: an SNMP device (the target definition — address and credentials), an SNMP sensor (what to poll and, optionally, when to alert), a policy the sensor is attached to, and an automation that routes that policy to the agent doing the polling.
Note: The SNMP target itself never runs NetLock RMM software. The polling is done by an ordinary managed device — a Windows, Linux, or macOS machine with the agent installed — that can reach the target on UDP port 161.
Before you start
- A managed device with the NetLock RMM agent installed, on a network from which it can reach the SNMP target on UDP port 161.
- The SNMP target's IP address and access details: the community string for SNMP v1 / v2c, or the username and auth / privacy credentials for SNMP v3.
- Console permissions for Sensors (
collections_sensors_enabled, pluscollections_sensors_add) — the same permission also governs SNMP device management.
Step 1 — Register the SNMP device
The SNMP device is the target definition. Open Devices (/devices), switch the view to SNMP, and choose Add.
In the Add SNMP Device dialog, fill in:
TenantandLocation— the tenant and location the device belongs to.Name— a label for the device.IP Address— the target's address.Port— the SNMP port,161by default.SNMP Version—v1,v2c, orv3.- For v1 / v2c:
Community String(oftenpublicfor read access). - For v3:
Username, anAuth Protocol(MD5orSHA) with its password, and optionally aPrivacy Protocol(DESorAES) with its password. Device Type— router, switch, firewall, printer, UPS, server, access point, or other.Notes— optional free text.
Save. The device now appears in the SNMP view, where you can edit or delete it later.
Step 2 — Create an SNMP sensor
The sensor decides what to poll on the target. Open Collections → Sensors, choose Add, and set Category to SNMP. Then pick the SNMP Type — this is the most important choice:
| SNMP Type | Purpose |
|---|---|
SNMP GET (Alert) | Polls one OID and alerts when its value crosses a threshold. |
SNMP Walk (Alert) | Walks an OID subtree and alerts if any returned value crosses a threshold. |
SNMP Monitor (Data Collection) | Polls a list of OIDs and collects the readings for display. It does not alert. |
For every type, select the SNMP Device you registered in Step 1 — the sensor takes the target's address and credentials from it.
For SNMP GET and SNMP Walk:
OID— the object identifier to query. The MIB Browser (the tree icon) helps you locate one.OID name— an optional friendly label.ConditionandThreshold value— when the sensor should trigger (equals,greater than,less than,contains,regex match, and so on).Max Walk Results— for Walk only, a cap on how many returned values are evaluated.- Notification and action thresholds, and an optional action script — these behave the same as for any other sensor (see Chapter 8.3).
For SNMP Monitor:
- Add the OIDs to collect — each with a method (
getorwalk), the OID, and a display name. The preset buttons (System Info,Interfaces,Storage) add common OID sets in one click. - There are no thresholds or actions; Monitor sensors only gather data.
Set the sensor's Platform to match the agent that will do the polling, then save.
Note: A sensor copies the SNMP device's address and credentials when it is created. If you later change those details on the SNMP device, re-open and save each sensor that targets it so the change is picked up.
Step 3 — Attach the sensor to a policy
A sensor only runs when a policy carries it. Open the policy assigned to your polling agent, go to the Sensors tab, and enable the SNMP sensor. See Chapter 6 for the policy editor.
Step 4 — Route the policy to the polling agent
A policy only reaches a device through an automation. Make sure an automation routes the policy from Step 3 to the managed device that will poll the SNMP target. See Chapter 5 for the automation model.
Once the policy is assigned, the agent polls the SNMP target on the sensor's schedule.
Verify it worked
- For a
GETorWalksensor: when the condition is met, an event is raised and any configured notification or action runs — checkEvents(see Chapter 12). - For a
Monitorsensor: the collected readings appear on the SNMP device's detail panel in theSNMPview of the Devices page, and the device's status and last-seen time update automatically.
Ad-hoc checks with SNMP Tools
Separate from sensors, SNMP Tools runs a one-off SNMP query through an agent — useful for testing an OID or confirming reachability before building a sensor. Open a managed device's detail view, choose SNMP Tools, and run a GET or Walk against any target IP.
SNMP Tools requires the devices_snmp_tools permission and the SNMP Tools toggle on the policy's Agent tab (which depends on remote service being enabled — see Chapter 6). It supports SNMP v1 and v2c only.
Troubleshooting
- No data and no events. Confirm the polling agent can reach the target on UDP port 161 — a firewall between them is the most common cause. The
SNMP Toolscheck above is the quickest way to test reachability. - Authentication failures. Re-check the community string (v1 / v2c) or the v3 username and auth / privacy settings. The target must also permit SNMP read access from the agent's IP.
- The sensor never runs. Confirm the sensor is enabled on a policy and that an automation routes that policy to the polling agent — both are required.
- Wrong OID. Use the MIB Browser when building the sensor, or
SNMP Toolsto walk the target, to confirm the OID returns the value you expect.
Related
- Chapter 8.3 — Sensors — the sensor library, thresholds, and action scripts.
- Chapter 6 — Policies — attaching sensors to a policy.
- Chapter 5 — Automations — routing a policy to a device.
- Chapter 12 — Events & Audit — where sensor alerts appear.
Reload licence information after a renewal
Self-hosted only: This guide applies to self-hosted deployments. On cloud, the hosted operations team manages licensing.
When a licence lapses — for example, it expired before a renewal went through — and you then renew it, the product can still report the licence as expired. The server and Web Console each cache the last licence information they loaded; until that cache is cleared, they keep showing the stale, expired state even though the Members Portal now holds a valid licence.
The fix is to delete the cached licence files and restart the services so they fetch fresh information. The API key does not change — this procedure only clears the cache.
Tip: For a routine re-query — after adding seats or upgrading a tier — use the
Refresh License Informationbutton onSettings → Licensingfirst (see A.1). Use the procedure below when the cached state is stuck and the button does not clear it.
Before you start
- Shell access to the host running the NetLock RMM containers.
- A renewed, valid licence on the Members Portal under the API key the deployment already uses.
Step 1 — Delete the cached licence files
Each service stores the licence it last loaded in internal/license_info.json. Delete both:
sudo rm /home/netlock/web_console/internal/license_info.json
sudo rm /home/netlock/server/internal/license_info.json
Step 2 — Restart the containers
Restart both services so they reload:
sudo docker restart netlock-rmm-web-console
sudo docker restart netlock-rmm-server
On startup, each service re-fetches licence information from the Members Portal with the existing API key and writes a fresh license_info.json.
Verify it worked
- Open
Settings → Licensingin the Console. The status badge should now readActive, with the correct name and seat count — see A.1.
Related
- A.1 — System overview & licensing — the Licensing page and the
Refresh License Informationbutton. - Replace the Members Portal API key — when the key itself, not just the licence, must change.
Remote-control a device via relay
NetLock RMM does not use VNC or RDP for remote control. Instead it streams the target device's screen over its own protocol with H.264 as the default encoding and JPEG polling as a fallback. This guide shows how to open a relay-mediated remote-control session from the device detail view.

Before you start
- The target device is online in the
Deviceslist. - Required permission:
devices_enabledplus the role flag that gates remote control in your deployment (typically exposed alongside the Remote Control action on the device detail view).
Install the Relay App (operator machine)
The Relay App runs on the operator's machine — the technician who opens the session — not on the target device. Download it from https://netlockrmm.com/downloads, pick your OS and architecture, and unzip it. Then install the FFmpeg runtime it uses to decode the device's H.264 screen stream locally.
FFmpeg runtime prerequisite
The Relay App decodes H.264 through FFmpeg's avcodec, avutil, and swscale libraries via P/Invoke. FFmpeg is not bundled in the download, so the runtime libraries must be present on the operator's machine. The app locates the platform's version-suffixed FFmpeg libraries automatically, so no renaming or symlinking is required — just install FFmpeg for your OS.
Linux
Install FFmpeg. On Debian and Ubuntu:
sudo apt install ffmpegOn non-Debian distributions, install the distribution's FFmpeg package. Fedora needs the RPM Fusion repository; openSUSE provides FFmpeg through Packman. Treat apt as the authoritative example and the others as equivalents.
macOS
Install Homebrew if it is not already present, then:
brew install ffmpegThis works on both Intel and Apple Silicon Macs — the app probes Homebrew's library directories (/opt/homebrew/lib and /usr/local/lib) automatically.
Windows
Install an FFmpeg shared build (the codec libraries ship as DLLs, not statically linked):
winget install Gyan.FFmpeg.SharedAlternatively, download a *-shared zip from gyan.dev or BtbN and add its bin\ folder to your PATH (or copy the DLLs next to NetLock_RMM_Relay_App.exe). The app loads the version-suffixed DLLs (avcodec-*.dll, avutil-*.dll, swscale-*.dll) directly, so no renaming is needed.
Note: Windows on ARM64 has no readily available FFmpeg shared build. Without it, the relay falls back to slower JPEG polling instead of hardware-accelerated H.264 decoding.
Verify the download
Compute the SHA-512 hash of the zip and compare it to the checksum shown on the download page:
| OS | Command |
|---|---|
| Linux | sha512sum <zip> |
| macOS | shasum -a 512 <zip> |
| Windows | CertUtil -hashfile <zip> SHA512 |
With the Relay App unzipped and FFmpeg in place, continue with the Steps below. For default behaviour, authentication, and deployment-wide settings, see Appendix A.7 — Remote screen control.
Steps
- Open
Devicesfrom the navigation and find the target device. - Select the device to open its detail view.
- Click
Remote Controlto open the Remote Control window. - In the connection-mode dropdown, pick
Relay (Recommended - faster). This is the default for any device whose Relay App is online. - Start the session. The window negotiates with the Relay App and connects to the target's screen.
The relay path prefers H.264, which is hardware-accelerated on the device's GPU where available with a software encoder fallback. If the relay's single H.264 slot is already occupied by another session, the path auto-falls-back to JPEG polling for this session. If the Relay Connection cannot be reached at all, the Console falls back further to SignalR (Legacy - fallback) — always JPEG-polled and slower, but it still works for emergencies.
Note: There is no VNC, RDP, or third-party remote-desktop protocol in the stack. The stream is NetLock RMM's own protocol end to end.
Verify it worked
- The Remote Control window shows the device's desktop and responds to mouse and keyboard input.
- The session appears in
Relay Server(at/relay_server) as anActiverow for the target device and the remote-control port, withConnectionsgreater than zero for the duration of the session. - When you close the window, the relay row transitions through
Disconnectingand returns toReady to connect(if persistent) or disappears (if temporary).
Troubleshooting
- Session connects but video is slow / blocky. The relay's H.264 slot may already be taken, forcing this session to JPEG polling. Close the other relay-mediated remote-control session on the same relay, or accept the reduced framerate.
- Relay session shows
Device offlinein the Relay Server list. The Relay App is not currently registered. Check the Relay App service on the device network and its API key. - Input reaches the device but the screen is black. Some idle devices skip frame generation. Move the mouse, wake the display locally, or check whether the session is restricted to a specific monitor.
Related
- Chapter 3.5 — Remote control and remote shell — the connection-mode picker, H.264 / JPEG trade-offs, and fallback chain.
- Chapter 9.2 — Relay Server — persistent and temporary relay sessions, lifecycle states, and how the Relay App registers.
- Appendix A.7 — Remote screen control — default behaviour, authentication, and deployment-wide settings.
Replace the Members Portal API key
Self-hosted only: This guide applies to self-hosted deployments. On cloud, the hosted operations team manages licensing — there is no API key for you to change.
The Members Portal API key is the credential the server and Web Console use to fetch your licence. It is a deployment credential and is not editable in the Console — the Licensing page shows it read-only (see A.1). Replacing it means editing each service's appsettings.json, clearing the cached licence and package data, and restarting the containers.
You replace the key on both services — the Web Console and the server. The paths below assume the standard deployment layout under /home/netlock.
Before you start
- Shell access to the host running the NetLock RMM containers.
- The new API key from the Members Portal.
- A short maintenance window is sensible: both services restart, and the server rebuilds its agent packages on first use afterwards.
Step 1 — Update the configuration files
Open each service's appsettings.json and set the new key in the ApiKeyOverride field, inside the Members_Portal_Api section:
sudo nano /home/netlock/web_console/appsettings.json
sudo nano /home/netlock/server/appsettings.json
In both files, replace the value of ApiKeyOverride with the new API key. Save and close each file.
Step 2 — Clear the cached licence and package data
Each service caches the licence it last loaded, and the server caches the agent installer packages it built under that licence. Delete these so they are regenerated against the new key:
sudo rm /home/netlock/web_console/internal/license_info.json
sudo rm /home/netlock/server/internal/license_info.json
sudo rm -r /home/netlock/server/internal/packages
Step 3 — Restart the containers
Restart both services so they read the updated configuration:
sudo docker restart netlock-rmm-web-console
sudo docker restart netlock-rmm-server
On startup, each service uses the new API key to fetch fresh licence information from the Members Portal, and the server rebuilds the agent packages it cleared.
Verify it worked
- Open
Settings → Licensingin the Console. The licence status, name, and seat count reflect the new licence — see A.1. If the status looks wrong, useRefresh License Informationon that page.
Code signing changes trigger an agent reinstall
If the new licence changes the code-signing entitlement — moving from a licence without code signing to one with it, or the reverse — the agents reinstall themselves automatically to match. The server rebuilds its agent packages under the new entitlement, which is why internal/packages is cleared in Step 2, and managed devices pick up the rebuilt agent on their next sync. No manual reinstall is needed.
Related
- A.1 — System overview & licensing — the Licensing page and what it reports.
- Upgrade NetLock RMM — pulling new container images.
Restrict USB devices on a group
USB access in NetLock RMM is an allowlist: anything not on the whitelist is blocked. There is no create-from-scratch dialog for whitelist entries — the only way to add one is through the approval flow on the Blocked Devices tab. In practice that means plugging in an intended USB device once so the agent reports it as blocked, then approving it with the chosen scope. This guide walks through that flow at group scope.

Before you start
- USB Device Control is enabled on the policy assigned to the target device: the policy's
Windows → USB Device Controlsection has the whitelist enforcement on. - The policy routes to the target group via an automation (see Guide H.4).
- You have the USB device in question and physical access to an affected Windows device in the group, or you can wait for a user to plug theirs in.
- Required permission:
collections_enabled,collections_device_control_enabled.
Steps
- On an affected device, plug in the USB device. The agent detects the attempt, blocks it, and reports it to the Console.
- In the Console, open
Collections → Device Controland switch to theBlocked Devicestab (route/device-control/blocked). - Find the row for the USB device. The Blocked Devices table shows
Count,Date,Reporting Device, the USB metadata (name and manufacturer), the deviceType(Mouse / Keyboard / HID / USB / DiskDrive / and so on), theDevice ID, theActions Taken, and a Pending status chip. - Confirm this is the intended device. If more than one pending row looks similar, select the row and open its details to verify the vendor-id, product-id, and serial encoded in the
Device ID. - Open the row's menu and pick one of the approval scopes:
Approve for this deviceApprove for tenantApprove for locationApprove for group— the choice for this guide.Approve globallyDismiss— if it was a mistake.
- When the scope dialog asks, pick the target group. The server inserts the device into the whitelist scoped to that group, flips the row's status chip to
Approved, and forces a resync so every device in the group picks up the updated whitelist.
Note: Scope is chosen once, at approval time. To widen or narrow a whitelist entry later, delete it from the Whitelist tab and re-approve the blocked-device entry with a different scope.
Verify it worked
- On the
Whitelisttab (route/device-control/whitelist) a new row appears with the USB device's metadata, thegroupscope chip, and the target group asScope Target. Status is on. - On any device in the approved group, the same USB device now connects successfully.
- On devices outside the group, the USB device continues to be blocked.
Troubleshooting
- USB device does not appear as blocked. Confirm the agent on the affected device enforces USB Device Control — the policy assigned to that device must have USB Device Control turned on in the
Windowstab. If it does not, edit the policy and save. - Approved but still blocked. Allow a sync cycle to pass — the whitelist push is immediate but the device must pick it up. Replug the USB device to trigger a fresh evaluation.
- Multiple similar rows appear. Each failed enumeration is logged as a separate attempt; approve one and delete the others, or dismiss the stragglers.
Related
- Chapter 8.7 — Device Control — full whitelist reference, including scope levels and matching granularity.
- Chapter 6.8 — USB Device Control — how a policy attaches the whitelist to devices.
- Guide H.4 — Build and apply a policy — routing the enforcement policy.
Run a compliance report and schedule email delivery
The Reports module turns data already in your NetLock RMM deployment into shareable documents. This guide walks through two common tasks against the same template: produce a report now for immediate use, then wire up a recurring weekly PDF email to keep stakeholders informed without anyone having to remember to run it.

Before you start
- A report template already exists that matches your compliance scope. If the deployment ships pre-built templates you will see them on the
Templatestab with aBuilt-inchip; tickShow Built-inif they are hidden. If no suitable template exists, build one with the Report Builder (see Chapter 11.3). - SMTP is configured if you want email delivery (see Guide H.10).
- Required permissions:
reports_enabled,reports_generatefor on-demand generation,reports_schedulesfor the scheduled run.
Steps
1. Generate the report on demand
- Open
Reportsfrom the navigation. - On the
Templatestab, find the compliance template you want to run. - Click the
Generateaction on the row to open the Generate Report dialog. - Fill in:
Format— pickPDFfor a human-readable document, orHTML,CSV, orJSONfor other use cases.Date range— pick a preset (last_24h,last_7d,last_30d,last_quarter,last_year) orautoto use the template's configured default.Email— optional. Fill in to email the result now; leave blank to just produce the file.
- Submit. The generated file lands on the
Generatedtab (and arrives by email if you filled in an address).
Tip: PDF output honours the brand template attached to the source template; the other formats ignore it. If your compliance PDF needs a customer-specific cover page, attach a brand template first in Chapter 11.5.
2. Schedule weekly email delivery
- Still on the Reports page, switch to the
Schedulestab. - Open the Schedule dialog to create a new scheduled run.
- Pick the same template you generated in step 1.
- Fill in:
Frequency—Weekly, with a day-of-week picker. Choose the day and time that suit your stakeholders.Hour(0–23) andMinute(0–59) — evaluated in the server's time zone.Date range— for a weekly email,last_7dtypically matches.Export format—PDF.Distribution—Email.Recipients— one or more addresses, comma-separated.SubjectandBody— the message that accompanies the attached report.
- Save.
Each week at the configured time the Console generates the report with the selected date range, renders it to PDF using the attached brand template, and emails it to every recipient as an attachment.
Verify it worked
- The
Generatedtab lists the on-demand run with the correct format and timestamp; you can re-download it from there. - The
Schedulestab lists the new schedule with frequency, next-run time, recipients, and format. - After the first scheduled run fires, each recipient receives the PDF in an email with the subject and body you configured. Subsequent runs arrive on the weekly cadence.
Troubleshooting
- No suitable template. Build one with the Report Builder. Non-admin users get the Visual Query Builder (
Table,Fn,Columns,Joins,Where,Logic,Op,Valuefields); admin users additionally getSQL Query (God Mode). See Chapter 11.3. - Scheduled email never arrives. Confirm SMTP is configured and tested (Guide H.10). Check the
Generatedtab — if the file is produced but not emailed, the failure is in delivery, not in generation. - PDF missing the brand cover. The source template has no brand template attached. Edit it in the Report Builder and attach one; PDF honours it, other formats do not.
- Time zone mismatch. Scheduled times use the server's time zone, not the viewer's. Cross-check with the administrator who configured the server.
Related
- Chapter 11 — Reports — full reference for templates, the Report Builder, widgets, brand templates, scheduled delivery, and community reports.
- Guide H.10 — Configure email and Microsoft Teams notifications — SMTP prerequisite for scheduled email delivery.
Set up patch management for a group
Patch management in NetLock RMM is split across two places that do different jobs, and getting both configured is what makes patching work. The /patch-management page is the global approval queue — "which patches are allowed on any device at all?" The Policy Settings editor's Patch Management tab is the per-policy rollout — "when and how do these particular devices install the approved patches?" This guide covers both, using a Windows group as the worked example.

Before you start
- A policy already exists and is routed to the target Windows group via an automation (see Guide H.4).
- At least one Windows device is online in that group.
- Patches have been detected and sit in the Pending state on the Patch Management page. If the list is empty, agents have not yet reported their update inventory — wait a sync cycle.
- Required permissions:
patch_management_enabledfor the approval page, pluspolicies_enabledand the policy edit flag for the rollout configuration.
Steps
Stage 1 — Approve patches globally
- Open
Patch Managementfrom the navigation. TheUpdate Approvaltab is the default. - Filter by
Windowsand browse the Pending patches. - Select a manageable first set — critical security updates from the previous month are a safe start. Avoid bulk-approving every pending patch on day one.
- Click
Approve. The selected patches move into the Approved state. The server flags every device for a resync so agents pick up the updated approval list on their next poll.
Use the other actions as needed:
Reject— explicitly block a patch; devices never install it.Defer— postpone a patch for a number of days (default 7).Reset to Pending— revert any state decision back to pending for later review.
Approvals are global. There is no per-device or per-group target selector on this page — scoping happens in stage 2.
Stage 2 — Configure the per-policy rollout
- Open
Policiesfrom the navigation and clickManageon the policy that routes to your Windows group. - Open the
Patch Managementtab in the Policy Settings editor. The tab is split intoGlobaland per-platform sub-tabs; pickWindows. - Under the Windows sub-tab, fill in at least these three sub-tabs for a minimal rollout:
General— enable patching for Windows and select which sources participate (at minimumOS-Mandatory, optionallyWingetandChocolatey).Schedule— pick a maintenance window. Outside the window the agent will not start an install.Reboot— decide whether the agent may reboot, whether it prompts the user, and how long the prompt is visible. This is the only place in the product where reboot behaviour is configured.
- Optionally fill in
Approval & Filtering(narrow approved patches by severity or source),Deployment Rings(stage the rollout acrossPilot → Early → Broad),Notifications, andRetry. - Save the policy.
Verify it worked
- On the Patch Management page's
Update Approvaltab, the patches you approved show theApprovedstate and theInstalledandPendingcolumns begin moving as devices pick up the change. - On a target device's detail view in
Devices, theEventsentries reflect patch install activity within the configured maintenance window. - The
Update Historytab on the Patch Management page shows the install outcomes per patch per device.
Troubleshooting
- Patches stay at 0 installed. Check that a policy with
Patch Management → Windows → Generalenabled is actually assigned to the device. If the device's detail view showsno_assigned_policy_found, the automation is missing. - Patches approved but devices ignore them. Check the policy's
Approval & Filteringsub-tab — a filter there can veto a globally approved patch. - Reboots happen at unexpected times. Review
Patch Management → Windows → RebootandSchedulein the policy. Reboot prompts follow the schedule's maintenance window. - SLA chips show
Overdue. Adjust the SLA thresholds on the Patch ManagementSettingstab if the defaults (7 / 15 / 30 / 60 days by severity) do not fit your environment.
Related
- Chapter 7 — Patch Management — the global approval queue, vulnerabilities tab, update history, and SLA settings.
- Chapter 6.12 — Patch Management tab — the complete per-policy rollout reference.
- Guide H.4 — Build and apply a policy — the prerequisite routing setup.
Uninstall an agent
This guide removes the NetLock RMM agent from a device and leaves it in a clean state — services deleted, processes stopped, install and data directories gone. It is the counterpart to Guide H.1. Uninstalling only affects the local device; the device record stays in the Console until you delete it there (see Verify it worked).
Before you start
- You have administrator or root access on the target device. The uninstaller deletes services and protected directories, so it requires elevation on every supported OS.
- You have the matching agent installer binary for the device's platform and architecture. Any build works for uninstalling — the embedded server configuration is ignored in this mode — but it must match the OS and architecture (for example a
win-x64build to uninstall on 64-bit Windows). If you no longer have the original.zip, rebuild one from the Agent Download wizard as described in Guide H.1. - The uninstaller is part of the Standard Installer (console). If you only kept the GUI Installer, download a Standard Installer build for the uninstall.
What gets removed
The uninstall mode performs a full cleanup, in order:
- Stops the services —
NetLock_RMM_Agent_Comm,NetLock_RMM_Agent_Remote, andNetLock_RMM_Agent_Health(plus the legacy 2.0.0.0 service names on Windows). - Terminates the processes — the three agent services, the user process, the UAC helper, and the tray icon.
- Deletes the services — removes the Windows services, the Linux
systemdunits under/etc/systemd/system/, or the macOS LaunchDaemons under/Library/LaunchDaemons/, and unregisters the user-process and tray-iconRunentries on Windows. - Deletes the directories and logs — the install tree under Program Files and the data tree under ProgramData, plus the agent service logs on Linux and macOS.
After it finishes, no NetLock RMM service, process, or directory remains on the device.
Steps
- Copy the agent installer
.zipto the target device (or locate the one you already deployed with). - Extract it and run the installer with the
uninstallargument from an elevated shell.
Windows (PowerShell, elevated):
Expand-Archive .\NetLockAgent.zip -DestinationPath .\NetLockAgent
.\NetLockAgent\NetLock_RMM_Agent_Installer.exe uninstall
For an unattended removal via GPO, Intune, or a script, combine uninstall with the same flags the installer accepts:
.\NetLock_RMM_Agent_Installer.exe uninstall --hidden --no-log--hidden/-h— hide the console window (Windows only).--no-log/--nolog— delete installer logs after completion.--temp <path>/-t <path>— use a custom temporary directory (useful on appliance distros that block execution from the default temp location).
Linux / macOS (Bash, with sudo):
unzip NetLockAgent.zip -d NetLockAgent
chmod +x NetLockAgent/NetLock_RMM_Agent_Installer
sudo ./NetLockAgent/NetLock_RMM_Agent_Installer uninstall- Wait for the installer to print
Uninstall complete.and exit with code0.
Note:
uninstallis one of the installer's positional modes, alongsideclean "<path-to-server_config.json>"(fresh install with an external config) andfix "<path>"(repair while preserving the server config). See Guide H.1 for the install and repair modes.
Verify it worked
- The installer reports
Uninstall complete.and exits without an error code. - The agent services are gone —
Get-Service NetLock_RMM_Agent_*returns nothing on Windows,systemctl status netlock-rmm-agent-commreports "not found" on Linux, andlaunchctl list | grep netlockis empty on macOS. - The install and data directories no longer exist:
- Windows —
C:\Program Files\0x101 Cyber SecurityandC:\ProgramData\0x101 Cyber Security. - Linux —
/usr/0x101_Cyber_Securityand/var/0x101 Cyber Security, and the logs under/var/log/netlock-rmm-agent-*.log. - macOS —
/usr/local/bin/0x101_Cyber_Securityand/Library/Application Support/0x101 Cyber Security.
- Windows —
- The device still shows in the Console — uninstalling does not delete the record. Remove it from
Devices(orUnauthorized Devices) by hand once the agent stops reporting in. See Chapter 3 — Managing Devices.
Troubleshooting
- "Failed to elevate" and the installer exits. The uninstaller needs administrative or root privileges to delete services and protected directories. Re-run from an elevated PowerShell prompt (Windows) or with
sudo(Linux / macOS). - A service is "marked for deletion" or a directory is locked. A process still holds a handle. The uninstaller already waits for the service manager to release handles, but if it raced an open management console or a running agent process, reboot the device and run
uninstallagain — the second pass clears any leftovers. - The device keeps reappearing in the Console. That is the cached device record, not a live agent. Confirm the services are gone (above), then delete the record in
Devices. If the device genuinely re-registers, an installer or deployment task is reinstalling it — check your GPO, Intune, or Ansible jobs. - Uninstaller fails on a Linux NAS or appliance distro. Some distributions — notably Synology and similar NAS systems — block execution from the default temporary directory. Re-run with
--temp <path>/-t <path>pointing at a directory the system permits execution from, then retry.
Related
- Guide H.1 — Deploy your first agent — build an installer and install the agent; also documents the
cleanandfixmodes. - Chapter 3 — Managing Devices — remove the device record after the agent is gone.
- Chapter 4 — Tenants — deleting a tenant requires uninstalling its agents first.
Upgrade NetLock RMM
This guide upgrades a NetLock RMM deployment to the latest release: first the server and Web Console, then the agents. The server side applies only to self-hosted deployments — on cloud, the hosted operations team upgrades the platform for you, and you only need the agent steps.
Before you start
- For the server upgrade (self-hosted): shell access to the host running the NetLock RMM containers, and the path to the
docker-compose.ymlthat defines your deployment. - For the agent upgrade: a Console account that can reach
Settings → Updatesand edit the policy your devices use — see A.2 and Chapter 6. - No database migration is required — see the note below.
Upgrade the Web Console and Server
Self-hosted only: This section does not apply to cloud deployments.
The server and Web Console ship as container images. Upgrading means pulling the latest images and recreating the containers. NetLock RMM deployments use a fixed compose-file path, so from the host this single command is all you need:
sudo docker compose -f /home/netlock/docker-compose.yml pull && sudo docker compose -f /home/netlock/docker-compose.yml up -d --remove-orphansNote: The database structure updates automatically when the new server image starts — there are no manual migration steps. The agent installer packages the server distributes are refreshed at the same time.
Check for new images automatically
To avoid pulling manually, you can run a container-update watcher such as Watchtower alongside the stack. The command below starts Watchtower with a 15-minute check interval:
sudo docker run --detach \
    --name watchtower \
    --volume /var/run/docker.sock:/var/run/docker.sock \
    --restart unless-stopped \
    nickfedor/watchtower \
    --interval 900
Watchtower is a third-party tool and is not part of NetLock RMM; adopt it at your own discretion.
Upgrade the agents
Agents update themselves once two switches are both enabled — one global, one per policy.
Step 1 — Enable platform updates
In the Console, open Settings → Updates. Enable the platforms you want agents to update on, and confirm that Max concurrent installations & updates is high enough for your fleet. See A.2 for what the concurrency value controls and how to size it.
Step 2 — Allow auto-update in the policy
Each device also obeys its policy. In the Policy Settings editor, on the Agent tab, confirm that Auto-update agent is on for the policy assigned to the devices you want to upgrade. See Chapter 6.
With both switches on, an agent installs the new version on its next sync.
Verify it worked
- The Web Console reports the new version once the server containers have restarted.
- A device shows the new agent version on its detail page after it has synced and applied the update.
Troubleshooting
- Agent not updating. Both switches must be on — the global platform toggle in
Settings → UpdatesandAuto-update agentin the device's policy. If either is off, the agent stays on its current version. - Slow rollout. Raise
Max concurrent installations & updatesinSettings → Updates, within what your network bandwidth supports — see A.2. - An agent upgrade failed. A failed agent upgrade normally recovers on its own — the agent's self-healing brings it back, usually within about 15 minutes.
- An update appears stuck on the server. Inspect the container logs with
docker logs <container-id>to see what the service reported.
Related
- A.2 — Updates & maintenance — the
Settings → Updatespage and the concurrency cap in detail. - Chapter 6 — Policies — the
Auto-update agentpolicy setting. - Deploy your first agent — installing an agent for the first time.
Write, test, and schedule a PowerShell script
NetLock RMM separates the Script (the code) from the Job (the schedule). A script lives in the Scripts library and can be reused; a job picks a script and defines when and how often it runs. This guide walks through authoring a trivial PowerShell script, saving it, and wrapping it in a job that runs once on a target device. See Chapter 8.1 and Chapter 8.2 for the full reference on both.

Before you start
- At least one Windows device is online and assigned a policy, so the agent is ready to execute a job.
- Required permissions:
collections_enabled,collections_scripts_enabled,collections_scripts_addfor the script;collections_jobs_enabled,collections_jobs_addfor the job.
Steps
Create the script
-
In the navigation, open
Collections → Scripts(route/manage_scripts). -
Click
Addto open the Add Script dialog. -
Fill in the fields:
Name— for exampleReturn current date.Description— a one-liner so others know what it does.Default timeout— accept the default for a small script.Platform—Windows.Shell—PowerShell.
-
Paste a trivial command into the editor:
Get-Date -
Save. The script now appears in the Scripts list.
Tip: The shell dropdown offers supported Platform / Shell pairs: Windows → PowerShell or Python3; Linux → Bash or Python3; macOS → Zsh or Python3; and System → MySQL for SQL-only scripts that run against the Console's own database.
Test the script with a one-shot job
Tip: The one-shot job below exercises the full job-execution path, but it is slow to iterate on — every change means editing the script, waiting for the scheduled time, and waiting for the next agent sync. While you are still getting the script's logic right, test it faster through the Remote Shell: open the target device, start a Remote Shell session, and run the commands directly for immediate output with no sync delay. Remote Shell must be enabled in the device's policy (
Agenttab →Remote Control) — see Chapter 6.4. Once the logic is correct, still run it once as a job to confirm it behaves the same under the agent's job runner — the two are different execution contexts.
- In the navigation, open
Collections → Jobs(route/manage_jobs). - Click
Addto open the Add Job dialog. - Fill in:
Name— for exampleReturn current date — one shot.Description— optional.Timeout— accept the default.Schedule— pickDate/Time(a one-shot schedule) and set the time a few minutes in the future.Platform—Windows.Type—PowerShell.Script— pick the script you just created.Hidden— leave off, so you can find the result in Events afterwards.
- Save.
- Attach the job to a policy that routes to your test device: open
Policies → Manage, pick the policy, open theJobstab, and enable the new job. Save the policy.
At the configured time the device's agent picks up the job, runs the script, and reports the result back.
Schedule it to recur
To convert this into a recurring job, edit the job and change the Schedule field from Date/Time to a recurring option — for example On specific days at time with a day-of-week toggle, or Every X hours. Save. Devices already assigned the job start using the new schedule on their next sync.
Verify it worked
- The Scripts list shows the new script with your platform, shell, and name.
- The Jobs list shows the job with the schedule summary you chose.
- In
Events, filter by the target device. An entry for the job execution should appear at the scheduled time withstdoutcontaining the current date. - Running the script as a non-hidden job also surfaces it in the device's detail view.
Troubleshooting
- Job never fires. Confirm the policy that carries the job is assigned to the device (
Devices → detail → Assigned policy). If not, fix the automation. - Job runs but no result appears in Events. The job may be flagged
Hidden— hidden jobs deliberately skip the Events view. Clear the flag for general-purpose scripts and reserve it for Custom-Field data collectors. - Script times out. Raise the
Default timeouton the script, theTimeouton the job, or both. Script timeouts are enforced and the script is terminated when the limit is hit.
Related
- Chapter 8.1 — Scripts — full Scripts reference including templates, Monaco editor, Community Scripts, and supported languages.
- Chapter 8.2 — Jobs — full Jobs reference including the twelve schedule types and the Hidden flag.
- Chapter 6.11 — Jobs tab — how a policy attaches jobs to devices.
System overview & licensing
Self-hosted only: This chapter is written for self-hosted deployments. On cloud, both pages still open but render a reduced view — a banner reads "Some settings that are available in the On-Premises version are not visible here. This is because our cloud team manages these.", and the deployment-level sections (MySQL health, File Server and Remote Server status, the Members Portal API key, and the editable storage limit) are hidden because the hosted operations team manages them. Cloud users still see the Web Console resource panel and storage-usage card on Overview and the licence status on Licensing; the rest of this chapter does not apply to them.
This chapter covers two administrative pages that share a common purpose — giving the deployment operator a view of how the system is performing and what the current licence allows. Both are predominantly observational: the Licensing page is entirely read-only, and the System Overview page is read-only apart from one setting, the System Storage Limit. Licence keys and connection strings are never editable in the Console; they are mutated outside it, in appsettings.json.
A.1.1 System Overview
Settings → Overview at /settings/overview is the first port of call when you want to answer "is everything healthy?" at a glance. It is almost entirely a monitoring page — it shows the live state of the four subsystems a self-hosted NetLock RMM deployment depends on, using the same data the agents and backend services use to do their work. The one exception is the System Storage Limit panel, which carries a single editable setting; everything else on the page is read-only.

The MySQL section
The database section answers two questions: is the database reachable, and is it under load. A status icon at the top of the section turns green when the Console has an active connection to MySQL and red when it does not. The panel reports:
Version— the MySQL server version string.Uptime— elapsed seconds since the MySQL instance started.Active connections— the number of sessions currently open against the server.Database size— total size of the NetLock RMM database, in bytes.Max connections— the configured upper limit for concurrent sessions.Failed logins— a running count of authentication failures since the database started.
Below those counters, a searchable table lists every active query the database is currently executing. Columns are Id, User, Host, Database, Command, Time, State, and Info. This is the view to open first when the Console feels slow — a long-running query or a connection pile-up often shows up here before it shows up anywhere else.
The Web Console section
Three cards summarise how much resource the machine hosting the Web Console is using right now:
CPU usage— a percentage with a progress bar.RAM usage— a percentage with a progress bar, plus aUsed / Free / Totalbreakdown in GB.Disk usage— a percentage with a progress bar, plus aUsed / Free / Totalbreakdown in GB.
The values are sampled from the Web Console host, not from any individual managed device. Use the section as an early warning when the Console itself is about to run out of headroom — a sustained high CPU number on this panel is a cue to scale the host, not the fleet.
System Storage Limit
The System Storage Limit panel is the one place on the Overview page that accepts input. It caps how much data the NetLock RMM system is allowed to store on disk — the on-screen description states this covers the devices/ and internal/ folders together with the MySQL database size.
A usage card shows current consumption as <current> GB / <limit> GB with a progress bar that shifts from green to amber at 90% and to red at 100%, plus a line reporting how many GB remain.
A second card carries the editable control: a Storage limit (GB) numeric field (1 to 999999) and a Save button. Set the value and save it to change the cap.
When consumption crosses a threshold the Console raises a dialog automatically — a warning at 90%, and a limit-reached dialog at 100% that cannot be dismissed by clicking away until you free space or raise the limit.
File Server and Remote Server status
Two smaller panels report the Console's ability to reach the other two backend services in a NetLock RMM deployment.
NetLock RMM File Server— showsConnectedwhen the Console can talk to the File Server,Not connectedotherwise. The File Server is responsible for agent downloads, script artefacts, and attachment storage.NetLock RMM Remote Server— showsConnectedwhen the Console can talk to the Remote Server, which handles remote control sessions and relay. A failed check here is accompanied by a PTR-mismatch warning when the probable cause is a reverse-DNS misconfiguration; the warning includes a link to the relevant documentation.
If either panel shows Not connected, use the Check again action at the top of the page to re-run the connectivity probe without reloading the entire page. The button is especially useful during an incident — rather than refreshing the entire Overview and losing any searches you have already typed into the MySQL active-queries table, Check again only retests the two service endpoints and updates their status chips.
A persistent Not connected state on either service is a signal to check the service's own host. For the File Server, confirm the service is running and that the Console host can reach it on its configured port; for the Remote Server, confirm the service is running and that the public DNS record resolves correctly — in particular, that the PTR record matches, because the warning message on the page exists precisely because PTR mismatches are the single most common cause of a failed Remote Server check.
What the page cannot do
Apart from the System Storage Limit, the Overview page is observational. Its only interactive controls are the Save button for the storage limit and the Check again button for the service connectivity probes. To change any of the monitored values — MySQL connection string, File Server URL, Remote Server URL — you edit appsettings.json on the Console host and restart the Console. There is no in-Console editor for connection strings by design: those values are part of deployment, not runtime configuration.
A.1.2 Licensing
Settings → Licensing at /settings/licensing reports the status of your NetLock RMM licence against the Members Portal. Like Overview, this page is mostly read-only — the one actionable control is a refresh button.

Members Portal API key
At the top of the page, an Enter your API key here text field shows the API key the Console uses to query the Members Portal. The field is read-only in the UI; its content is loaded from appsettings.json at startup. A helper note beneath the field states:
The API key can only be changed in the appsettings.json.
This is deliberate — the licence key is a deployment credential. Keeping it out of the Console prevents an admin from accidentally overwriting it on production and prevents a user with settings_enabled from seeing or changing the key without filesystem access to the host.
License status
The second section summarises the licence itself:
- A status badge —
Active(green) when the licence is in good standing,Expired(red) when it has lapsed. - The licence name, which reflects the tier you are subscribed to.
- A code-signing row. When code signing is included in your tier, the line reads
Code signing enabled. When it is not, the line readsCode Signing not availablewith the sub-textAvailable from Tier 1 for professional deployments. Code signing affects how agent installers are trusted on the managed devices; the absence of it is not a blocker for most deployments, but it is a meaningful signal for larger customers. - A licence-count row shown as
X / Ywith a progress bar, whereXis the number of seats you are currently consuming andYis the total you are licensed for. Seat consumption is driven by approved devices — unauthorised devices (see Chapter 3.2) do not count until they are approved.
Actions
Two buttons sit alongside the status section.
Refresh License Information— re-fetches the licence record from the Members Portal. The button is disabled when no API key is configured. Use this after renewing a licence, adding seats, or upgrading a tier — the Console caches the licence state and does not automatically re-query.Upgrade— shown only when code signing is not available for your current tier. The button openshttps://www.netlockrmm.com/pricingin a new tab so you can compare plans. There is no in-product checkout flow; upgrades are handled on the pricing page and through your account manager.
What the page does not do
There is no licence-key entry field, no "replace licence" affordance, and no in-product billing view. The page reads; it does not write. If you need to change the API key you edit appsettings.json. If you need to change the plan you do so on the pricing page or through the Members Portal, then come back to the Licensing page and click Refresh License Information to pull the updated status.
Cross-reference
Licensing settings are not accessible on cloud deployments — the cloud team handles billing and licensing centrally. If you log in to a cloud tenant and cannot see this page, that is by design.
Permissions
| Page | Required flags |
|---|---|
Settings → Overview | settings_enabled, settings_overview_enabled |
Settings → Licensing | settings_enabled, settings_licensing_enabled |
Both flags must be set on a user's permission matrix (see Chapter 14) for the corresponding page to appear in the navigation.
Related chapters
- Chapter A.3 — Database management. The Overview page reports MySQL health; A.3 is where you configure retention and run optimisation.
- Chapter A.2 — Updates & maintenance. The concurrency cap that governs agent installers lives there.
- Chapter 14 — Users & Roles. Where you grant
settings_enabledand the per-page flags. - Chapter 9 — File Server & Monitoring. Covers the File Server and Relay Server services the Overview page probes.
Updates & maintenance
This chapter covers two small admin pages that often end up in the same maintenance-window conversation: the Updates page, which controls how aggressively the server rolls updates out to agents, and the Maintenance page, which lets you silence outbound notifications while you do planned work.
Be aware of the scope before you read on. The Updates page in the current release exposes one setting — concurrency. There is no product-update installer UI, no forced-update button, no update history, and no release-notes view inside the Console. Product updates of NetLock RMM itself are handled outside the Console. If you came to this chapter looking for a "check for updates" button, it does not exist in this release.
A.2.1 Updates — concurrent installation throttle
Settings → Updates at /settings/updates has exactly one configurable field plus a Save button.

The field
Max concurrent installations & updates is a numeric value that caps how many devices the server will process at the same time when installing new software packages or applying update approvals. Ranges differ by deployment:
| Deployment | Minimum | Maximum |
|---|---|---|
| Cloud | 1 | 50 |
| Self-hosted | 1 | 9999 |
The default is loaded from the database on page open.
Why the cap exists
Two information panels on the page spell out the rationale, and it is worth understanding so you pick a sensible value.
- In-memory package delivery. The server loads each installation package into memory once and serves every download from that single cached copy. Holding more downloads open at the same time does not multiply that memory — the cached packages are a fixed cost, independent of the concurrency number. Because delivery is from RAM, neither disk I/O nor CPU is the constraint; the limiting factor is network bandwidth.
- Bandwidth-limited rollout. Even on a fast network, the agents in any given location share egress. A concurrency ceiling keeps a mass rollout from saturating a branch uplink or degrading the Console for other users. Each in-progress update also writes to the MySQL database in the background, so the database host's capacity is a secondary consideration when setting a high value.
The cloud cap of 50 reflects the hosted platform's infrastructure envelope; on self-hosted deployments you can raise the number up to 9999, but the practical ceiling is almost always lower than the configured one and is determined by your available network bandwidth — and, to a lesser degree, by the MySQL database load that concurrent updates generate. Start conservative and measure before raising the number.
Applying the change
After editing the number, click Save. The new value takes effect on the next rollout cycle; no restart is required. The throttle affects the queues used for software deployment (Chapter 8.8) and patch approvals (Chapter 7), but does not affect one-off remote actions such as reboot, shutdown, or scripted jobs.
What is not on this page
- No product-update installer for NetLock RMM itself.
- No forced-update-now button for agents.
- No update history, logs, or per-device install status — those live in Events (Chapter 12) and in the Software Deployment detail pages (Chapter 8.8).
- No release-notes viewer. Release notes live on the NetLock RMM website.
A.2.2 Maintenance — silencing notifications on demand
Settings → Maintenance at /settings/maintenance exists so you can switch notifications off while you work. It does not stop agents from running, does not stop scripts from executing, and does not stop events from being recorded — it only prevents outbound notifications leaving the server. When a planned maintenance window lifts, events that accumulated during the window are automatically marked as read rather than surfacing as a backlog of alerts.
A live status banner at the top of the page reflects the current state. When any trigger is active, it reads:
Maintenance mode is currently ACTIVE. Notifications are being suppressed (manual toggle | window '<name>' | …).
When nothing is active, it reads:
Maintenance mode is currently inactive. Notifications are being processed normally.
The banner lists which trigger is causing suppression, so if both a manual toggle and a scheduled window are active you will see both called out.
The page has two tabs: Manual and Scheduled Windows.

Manual maintenance mode
The Manual tab has a single toggle, Enable manual maintenance mode, and a Save button.
When the toggle is on, the server suppresses outbound notifications on every channel the deployment has configured:
- Microsoft Teams
- Telegram
- ntfy.sh
- Webhook
Events still accumulate in the Events log as they normally would, and during suppression they are automatically marked as read so you do not find yourself facing a wall of overnight alerts the moment you disable the toggle.
Use the manual toggle for unscheduled work — reboots you are doing now, network changes in progress, a firewall reconfiguration where the fleet will temporarily look offline. Turn it off when you are done; there is no auto-timeout.
Scheduled maintenance windows
The Scheduled Windows tab covers recurring windows — for example a weekly Sunday patching slot that you want to suppress every week without remembering to toggle anything. The tab's master toggle, Enable scheduled maintenance windows, switches evaluation on and off as a group; when it is off, none of the configured windows apply.
Underneath the master toggle is a table of windows with one row per window and the following columns: Name, Weekdays, From, To, Enabled, and Actions. Each row's Actions cell exposes Edit and Delete.
Click Add window to open the window editor. The editor fields are:
Name (optional)— a friendly label. The helper text suggests something likeWeekly Sunday Patch Window. The field is optional; when blank the table shows a record number instead.- Weekday checkboxes for Monday through Sunday. At least one weekday must be selected. Weekdays are stored internally as ISO day numbers (1 = Monday, 7 = Sunday).
From— the window start time in 24-hourHH:mmformat.To— the window end time in 24-hourHH:mmformat. WhenTois earlier thanFrom, the window wraps past midnight — for example,From 22:00andTo 02:00suppresses notifications from ten in the evening to two the next morning. The table row for such a window displays a+1dchip so there is no ambiguity.Window enabled— per-window toggle. Disable a single window without deleting it when you want to keep its definition but skip it this month.
All windows are evaluated in the server's local time — not UTC, not the authenticated user's browser time. If your team is distributed across time zones, decide a single zone for your maintenance rota and stick to it.
Editing and deleting windows
Edit in the table actions reopens the editor with the existing values. Delete opens a small confirmation dialog titled Delete maintenance window with a body message of Delete window '<name or #id>'?. Confirm to remove the window permanently; there is no undo.
Permission nuance
Viewing the page requires settings_maintenance_enabled. Making changes — toggling the manual switch, adding, editing, or deleting windows — requires settings_maintenance_manage. Without the manage flag, the page renders read-only: you can see the current state but none of the controls respond.
Permissions
| Action | Required flags |
|---|---|
View Settings → Updates | settings_enabled, settings_updates_enabled |
View Settings → Maintenance | settings_enabled, settings_maintenance_enabled |
| Change maintenance settings | settings_enabled, settings_maintenance_enabled, settings_maintenance_manage |
Related chapters
- Chapter 7 — Patch Management. The approval queue feeds the rollout throttle this chapter governs.
- Chapter 8.8 — Software Deployment. Deployments respect the concurrency cap.
- Chapter A.8 — Notifications deep dive. Maintenance mode suppresses the channels configured there.
- Chapter 12 — Events & Audit. Events continue to record during maintenance; they are auto-marked as read.
Database management
Self-hosted only: The Database Management page is hidden on cloud deployments. The hosted team manages retention, optimisation, and backup centrally; the page renders the same "Some settings that are available in the On-Premises version are not visible here" notice as Overview and Licensing. This entire chapter applies only when you run NetLock RMM on your own infrastructure.
Settings → Database at /settings/database is where the deployment operator controls how much history the database keeps, keeps MySQL tables healthy, and — for power users — runs ad-hoc SQL against the schema. The page is split into two tabs: Retention & Cleanup and SQL Console. The SQL Console tab is gated behind its own permission flag, so not every administrator with settings_database_enabled will see it.
Before going further, set expectations on what this page does not do. It is not a connection-config editor, not a backup or restore UI, and not a schema-upgrade tool. NetLock RMM does not ship with a migration system inside the Console; database schema changes are delivered as standalone SQL scripts that you run directly against MySQL outside the Console. The connection string itself is loaded from appsettings.json at startup and cannot be edited from the UI.
A.3.1 The Retention & Cleanup tab
The first tab is the one most admins live in. It lets you set, per table, how long NetLock RMM keeps historical rows before the nightly cleanup job removes them.

How the grid works
The tab lists more than fifty tables — one row per table — covering every category of time-series data the product produces. You will find rows for events, audit, agent heartbeats, remote session recordings, script output, sensor samples, patch history, ticket activity, and so on. Each row has two controls:
Enable cleanup— a per-table toggle. When off, the cleanup job never touches this table, regardless of the day count. When on, the job removes rows older than the configured threshold.Delete entries older than (days)— a numeric input in days. The value is interpreted relative to the row's own timestamp column; rows younger than the threshold are retained.
Cleanup runs automatically on a server-side schedule; you do not need to invoke it by hand. If a table is toggled on but has no value (or 0), cleanup does nothing for that table.
The toolbar
Four buttons sit at the top of the tab:
Enable all— turnsEnable cleanupon for every row at once. Useful when you first set the page up and want to start from a blanket-on baseline before tuning individual tables.Disable all— the inverse: turns cleanup off for every row. Useful for a temporary freeze when you want to preserve history for a forensic investigation.Apply recommended defaults— loads the vendor's recommended retention values for each table. This is the starting point we recommend you use on a fresh deployment; adjust individual rows afterwards to match your compliance and storage budgets.Save retention settings— commits every change on the tab. Edits are not applied until you save.
Choosing retention values
There is no single right answer; the correct value depends on your compliance posture and your disk budget. A few rules of thumb:
- Operational tables (heartbeats, short-lived sensor samples) usually survive comfortably on 30 days.
- Audit-adjacent tables (who did what, when) typically require longer — 180 days is a common floor, and regulated environments often push to 365 days or beyond.
- Session recordings grow fastest on disk; if you have tight storage, a shorter retention here pays for itself quickly. The Remote Screen Control page (Chapter A.7) also exposes a separate
Auto purgespecifically for session recordings.
Start with Apply recommended defaults, monitor the database size from the Overview page (Chapter A.1.1), and narrow down from there.
Cleanup behaviour
The cleanup job runs on the server, not the Console, and uses the current retention settings each time it runs. Changing a value does not trigger an immediate cleanup pass — the new value takes effect on the next scheduled run. If you reduce a value substantially and want the space back sooner, you can run the Optimize database action (below) after the next cleanup pass completes to reclaim the freed space.
A.3.2 Optimising database tables
Alongside the retention controls, the Database Management page has an Optimize database action. Clicking it opens a confirmation dialog:
Optimize database tables?
This runs OPTIMIZE TABLE on all major tables. Tables may be briefly locked; running against a multi-GB database can take several minutes. Continue?
Choosing Optimize runs MySQL's OPTIMIZE TABLE sequentially across every major table in the NetLock RMM schema — more than fifty tables in total. The action reclaims disk space freed by deleted rows and rebuilds indexes, which can noticeably improve query performance after a large retention-cleanup pass or a long period of heavy writes.
Caution:
OPTIMIZE TABLEbriefly locks each table it processes. On a large NetLock RMM database the whole run can take several minutes, during which parts of the Console will feel sluggish. Run the action off-peak, ideally from within a maintenance window (see Chapter A.2.2) to prevent noisy notifications for the duration.
When to run it
There is no automatic schedule — the action is manual on purpose. Reasonable triggers for running it include:
- Immediately after a first-time
Apply recommended defaultssave, once the cleanup job has had a chance to run. - After a deliberately short-retention pass where you expect to have freed substantial space.
- On a quarterly or semi-annual cadence for a large, long-running deployment.
There is rarely a need to run Optimize database more often than once a month.
A.3.3 The SQL Console tab
The second tab — SQL Console — gives administrators a free-form SQL editor against the NetLock RMM database. It is a power-user tool and is gated separately:
Requires permission:
settings_system_mysql_console. Without this flag the tab does not appear at all.

The editor
The tab is deliberately simple: a multi-line Query textarea with placeholder text Enter SQL query..., and two buttons.
Executeruns the query against the current NetLock RMM database. The default query timeout is 30 seconds; long-running statements are cut off to prevent a runaway query from holding the connection pool.Clearempties the editor.
Query results render as a standard table beneath the editor. Column headers come from the query's column list, and rows are paginated when results are large.
The Cell Value dialog
Clicking a cell opens the Cell Value dialog, which shows the full value without table-row truncation. The dialog includes:
- The originating column name as its title.
- The cell's length in characters.
- A
Copybutton that places the value on the clipboard. - A
Closebutton.
When the cell contains JSON — which is common for NetLock RMM fields that store structured configuration — the dialog pretty-prints the JSON with syntax-friendly indentation so it is readable. This is the fastest way to inspect a single policy's JSON blob or a theme palette entry without leaving the Console.
Guardrails and responsibility
The SQL Console runs against the live production database under the Console's connection credentials. There is no preview mode and no read-only enforcement — an UPDATE, INSERT, or DELETE issued here commits straight through. Two principles keep this safe:
- Only grant
settings_system_mysql_consoleto deployment operators who need it. It is a dangerous flag to hand out casually. - Use the console for read queries by default. When you do need to mutate data, assume you will need to re-run the same statement against a backup; take a logical dump of the affected tables first.
The SQL Console is not a substitute for the regular admin pages. Prefer the dedicated UI for anything it can do — Retention & Cleanup, Users, Tenants, Policies — and reserve the SQL Console for diagnostics and the rare fix that no UI covers.
What the SQL Console cannot do
- It cannot switch databases; the connection is fixed to the one configured in
appsettings.json. - It cannot source multi-statement scripts; run one statement at a time.
- It cannot stream large result sets — practical result size is limited by the page's ability to render rows.
A.3.4 What this page does not cover
To save you searching, here is what the Database Management page does not do in the current release. Each item is handled elsewhere (or not in the Console at all):
- Connection string editing.
MySQL.Connection_Stringis read once fromappsettings.jsonat startup. To change it, edit the file on the Console host and restart the Console. - Backup and restore. There is no backup or restore button in the Console. Backups are your responsibility at the host level; the recommended approach is
mysqldumpon a schedule outside NetLock RMM, with backups shipped to offsite storage. - Schema upgrades. Schema changes between NetLock RMM releases are delivered as standalone SQL scripts with the release. Run them directly against MySQL outside the Console; there is no in-product migration runner.
- Per-tenant retention. Retention is global — applied to the table, not to the rows belonging to a specific tenant. If a particular tenant requires a different retention posture, that is achieved by filtering the reports you deliver them, not by database configuration.
- Automatic backup on the optimise action.
Optimize databasedoes not take a backup before running; it assumes you have your own backup strategy in place. Take a backup out-of-band if you need a guaranteed rollback point. - Query history in the SQL Console. The SQL Console does not record a history of past queries. If you rely on a particular diagnostic statement repeatedly, keep it in your own notes or a script file rather than expecting the Console to remember it.
Suggested operator workflow
For a healthy operator cadence, the following rhythm covers most deployments:
- On a fresh deployment, open the page, click
Apply recommended defaults, andSave retention settings. This gives you a sensible starting point out of the box. - A few days later, review the database size in
Settings → Overview(Chapter A.1.1). If growth is faster than expected, narrow down the retention on the noisiest tables (typically event tables, heartbeat tables, and script-output tables) and save again. - Once per quarter, run
Optimize databaseduring a maintenance window. Expect the run to take anywhere from under a minute on a small deployment to several minutes on a multi-gigabyte one. - Delegate the SQL Console permission (
settings_system_mysql_console) only to the operators who regularly need it; revoke it for people who occasionally need one-off lookups but can have you run the query for them.
This light-touch workflow keeps the database healthy without turning it into a permanent source of admin work.
Permissions
| Capability | Required flags |
|---|---|
| View the page | settings_enabled, settings_database_enabled |
| See the SQL Console tab | settings_enabled, settings_database_enabled, settings_system_mysql_console |
Related chapters
- Chapter A.1 — System overview & licensing. The Overview page reports live MySQL health and active queries.
- Chapter A.2 — Updates & maintenance. Use a maintenance window to cover a large optimise run.
- Chapter A.7 — Remote screen control. Session recordings have their own retention control that sits alongside this page's.
- Chapter 12 — Events & Audit. Event and audit retention are driven from this page's grid.
Security: IP whitelist & SSO
This chapter covers the two security controls that most deployments configure early in their lifecycle: restricting which source IPs can reach the product, and replacing local passwords with single sign-on. The two features are unrelated mechanically, but they share an admin audience and a common theme — they determine who gets through the front door.
Both features apply to cloud and self-hosted deployments. Both, when changed, restart the Web Console and disconnect every signed-in user. Plan the change accordingly, and if possible do it during a maintenance window so notifications are suppressed for the duration (see Chapter A.2.2).
A.4.1 IP Whitelist
Settings → IP Whitelist at /settings/ip-whitelist controls which source IP addresses are permitted to reach either the Web Console or the Backend services. The page has two tabs — Web Console and Backend — and each tab maintains an independent list.

The two scopes
The whitelist is split because the two surfaces serve different traffic. The Web Console is where your administrators sign in; its traffic originates from their workstations and office networks. The Backend is where agents and other server-to-server components talk to NetLock RMM; its traffic originates from the fleet's devices, relays.
A whitelist that is correct for the Web Console is almost never correct for the Backend, and vice versa. Treat them as separate decisions. Most deployments end up with a narrow Web Console whitelist (admin workstations and a VPN range) and a wider — often empty — Backend whitelist (agents connect from anywhere the fleet runs).
The Web Console tab
The tab opens with an informational alert:
Configure IP addresses that are allowed to access the Web Console. Enter IP addresses separated by commas. Leave empty to allow access from all IPs. The application will restart after saving.
Beneath the alert is a five-line text area labelled Allowed IP Addresses (comma-separated) with helper text:
Example: 192.168.1.100, 10.0.0.5, 172.16.0.1
Enter one IP address per comma-separated item. Each entry is validated with standard IP-address parsing; an invalid value raises an inline error like Invalid IP address: <ip> and prevents the save. An empty field is a legitimate value that means allow all source IPs — this is the default state on a fresh deployment.
Below the textarea is a Save & Restart button. Clicking it opens a confirmation dialog with the title Warning:
The web console will automatically restart after saving the IP whitelist configuration. All active user sessions will be terminated. Do you want to continue?
Confirming the dialog saves the value and immediately restarts the Web Console. Every signed-in user — including you — is booted to the login page. If your new whitelist does not include your own source IP, you will not be able to sign in again afterwards. Double-check the list before you confirm.
Caution: The whitelist is the only gate here. There is no master kill-switch on the page that bypasses it. If you lock yourself out, the only recovery is direct database access — an operator on the Console host must clear
settings.ip_whitelist_web_consolein MySQL and restart the Console.
The Backend tab
The Backend tab has the same textarea and the same helper text, and it enforces the same validation. Its informational alert is slightly different:
Configure IP addresses that are allowed to access the Backend services. Enter IP addresses separated by commas. Leave empty to allow access from all IPs. This configuration will be applied when the backend services restart.
The button is also labelled Save & Restart, but this tab does not show a confirmation dialog before saving. Clicking the button writes the value and surfaces a snackbar that reads Backend IP Whitelist saved successfully!. The backend services pick the new list up when they next restart.
The asymmetry is deliberate. Saving the Web Console whitelist terminates the admin's own session, so a confirmation makes sense. Saving the Backend whitelist does not disturb the admin's session at all, so no confirmation is needed.
The agent backend is designed to be exposed directly to the public internet — that is its normal operating posture, because agents connect to it from wherever the managed devices run: home networks, branch offices, mobile connections. Agents authenticate to the backend with credentials provisioned into the installer when it is built, so reaching the backend endpoint is not the same as being able to use it: a caller without valid agent credentials for your deployment gets nowhere. This is why the Backend whitelist is optional — it is defense-in-depth layered on top of the application-layer authentication, not the primary gate. Leaving the Backend list empty is a supported and common configuration. Populate it only when your fleet genuinely egresses from a fixed, known set of IP addresses and you want the additional network-layer restriction; for a fleet that connects from anywhere, an empty Backend list is the expected setup.
What the whitelist does and does not do
The whitelist is a network-layer control. It compares the source IP of an incoming request to the configured list and rejects requests outside it at the authentication and middleware layers. It has the following properties:
- Allowlist semantics with an empty-equals-all escape hatch. An empty list means "allow all"; a non-empty list means "allow only these". There is no explicit block list.
- No per-user scope. The list applies to all administrators equally. You cannot say "this IP is allowed for Alice but not Bob."
- No per-API-key scope. The list applies to all authentication types on the relevant surface.
- No description or comment field per entry. If you need to remember why a specific IP is in the list, keep a separate note — the UI stores the IPs only.
- IP addresses only. The field accepts individual IP addresses; it does not accept CIDR blocks, DNS names, or wildcards.
For deployments that operate behind a reverse proxy or load balancer, make sure the proxy is configured to forward the client's real IP (for example via X-Forwarded-For with trusted-proxy handling). If the proxy terminates the connection and the Console sees only the proxy's IP, every request will appear to come from the same source.
Operating tips
- Add your new IP before removing the old one. The list is live at the moment of save; replacing an entry on the same save means there is no window during which both are valid.
- Test from a device on the new network before saving — for example, by temporarily tethering a laptop to the new connection and verifying reachability.
- After changing the Web Console list, confirm you can still sign in as an unprivileged account as well as your admin account. An unprivileged account that cannot sign in because of IP filtering will not be able to report the problem to you.
- Review the list annually. Old office ranges and defunct VPN gateways accumulate quickly.
- When a technician leaves and the reason for the departure was contentious, rotate the whitelist on the same day you disable the account. Whitelists sometimes survive an account deletion longer than they should, and a stale entry pointing to a home IP is a sharper risk than most admins realise.
Interaction with SSO
IP whitelisting and SSO are complementary, not alternatives. When both are in effect, a request must pass the IP filter and satisfy an SSO-compatible identity before it gets in. In practice this means:
- A user on a whitelisted IP with the wrong identity is still refused.
- A user with a valid SSO identity but an unwhitelisted source IP never sees the SSO sign-in page — the IP filter runs first at the middleware layer.
If you operate a strict IP-restricted environment and also use SSO, verify that both gates are configured independently before rolling out. Missing one does not compromise the other, but it does create a misleading failure mode where users blame the identity provider for what is actually an IP filter rejection.
A.4.2 Single Sign-On
Settings → SSO at /settings/sso configures OpenID Connect for the Web Console. Once SSO is enabled and a user account's authentication mode allows SSO, that user signs in through their identity provider instead of (or in addition to) a local password.

Supported providers
Five providers are supported, each on its own tab:
- Azure AD
- Keycloak
- Google (Workspace / Identity)
- Okta
- Auth0
All five are OpenID Connect. SAML 2.0 is not supported in the current release. If your identity provider is reached through SAML only, you will need a bridge (such as a federation layer that translates SAML to OIDC) between it and NetLock RMM.
One provider at a time
Only one SSO provider can be active at any given time. Each provider tab has its own Enable <Provider> switch; turning one on automatically turns the others off. The page shows an informational alert calling this out, so you do not accidentally leave two providers enabled on different tabs.
Pre-requisites before you open the page
- A valid paid licence. Saving the SSO configuration requires code-signing availability on your licence (
License.CodeSigned). Without it, a licence reminder dialog blocks the save and points you to the pricing page. - Pre-provisioned user accounts. NetLock RMM does not auto-create accounts on first SSO sign-in. Every user who will sign in via SSO must already exist in
Userswith theirAuth Modeset toSSOorPassword & SSO, and the username on the NetLock account must match the email claim the provider returns. See Chapter 14.2 for how to create users with the correct auth mode. - A registered application on the identity provider. The identity provider needs a client registration pointing back at your Console. The redirect URI is
https://<public-host>/<callback-path>— see the section on callback paths below.
Azure AD fields
| Field | Helper / example |
|---|---|
Instance | e.g., https://login.microsoftonline.com/ |
Domain | e.g., your-domain.onmicrosoft.com |
Tenant ID | |
Client ID | |
Client Secret | Password input, masked. |
Callback Path | e.g., /signin-oidc |
Signed Out Callback Path | e.g., /signout-callback-oidc |
Response Type | e.g., code |
Save Tokens | Toggle. |
Required: Client ID, Client Secret, Tenant ID, Domain.
Keycloak fields
| Field | Helper / example |
|---|---|
Authority | e.g., https://keycloak.example.com/realms/your-realm |
Realm | |
Client ID | |
Client Secret | |
Callback Path | e.g., /signin-keycloak |
Signed Out Callback Path | e.g., /signout-callback-keycloak |
Response Type | e.g., code |
Save Tokens | Toggle. |
Get Claims From UserInfo Endpoint | Toggle. Default on. |
Require HTTPS Metadata | Toggle. Default on. Only disable for local development. |
Required: Authority, Client ID, Client Secret.
Google fields
| Field | Helper / example |
|---|---|
Client ID | e.g., your-client-id.apps.googleusercontent.com |
Client Secret | |
Callback Path | e.g., /signin-google |
Signed Out Callback Path | e.g., /signout-callback-google |
Hosted Domain (Optional) | Restrict to a specific Google Workspace domain. |
Save Tokens | Toggle. |
Required: Client ID, Client Secret.
Okta fields
| Field | Helper / example |
|---|---|
Domain | e.g., dev-12345.okta.com |
Client ID | |
Client Secret | |
Callback Path | e.g., /signin-okta |
Signed Out Callback Path | e.g., /signout-callback-okta |
Authorization Server ID (Optional) | e.g., default |
Save Tokens | Toggle. |
Get Claims From UserInfo Endpoint | Toggle. |
Required: Domain, Client ID, Client Secret.
Auth0 fields
| Field | Helper / example |
|---|---|
Domain | e.g., your-tenant.auth0.com |
Client ID | |
Client Secret | |
Callback Path | e.g., /signin-auth0 |
Signed Out Callback Path | e.g., /signout-callback-auth0 |
Audience (Optional) | API identifier for a custom API. |
Save Tokens | Toggle. |
Required: Domain, Client ID, Client Secret.
Callback paths and redirect URIs
Each provider tab asks for a Callback Path (and its signed-out counterpart) as a path, not a full URI. The Console constructs the full redirect URI at runtime by combining the public host of the Console with the path. When you register the application at the identity provider, you assemble the full URI manually:
https://<public-host>/<callback-path>For example, with a Console at https://console.example.com and the default Azure AD callback path of /signin-oidc, the redirect URI you register at Azure AD is https://console.example.com/signin-oidc.
If you leave the callback path field blank, the Console falls back to the per-provider default listed in the helper text on each field (/signin-oidc for Azure AD, /signin-keycloak for Keycloak, and so on). The defaults work; use them unless you have a reason not to.
User provisioning — the one rule to remember
SSO login does not create NetLock accounts on demand. When a user signs in via SSO, the Console extracts the email address from the identity provider's token and looks for an account with a matching username that has an SSO-compatible authentication mode. In plain English: the account must already exist, and its Auth Mode must be either SSO or Password & SSO.
If the account does not exist, or if it exists but its Auth Mode is Password only, the Console rejects the sign-in with:
User is not authorized for SSO login. Please contact your administrator.
When a new technician joins your team, provision their NetLock account first (see Chapter 14.2), set their Auth Mode to SSO or Password & SSO, and make sure the username exactly matches the email address they will authenticate with at the identity provider. Only then point them at the Console's login page.
Auth modes recap
When you create a user, you pick one of three auth modes (also covered in Chapter 14.2):
Password— local password only. Cannot sign in via SSO.SSO— SSO only. The local password slot is disabled.Password & SSO— either mechanism. Useful during migrations, where you want to keep password fallback available until every user has successfully used SSO at least once.
Saving the configuration
The SSO Settings page has a single Save button. There is no in-Console Test button and no round-trip test pass — you validate by signing out and attempting an SSO sign-in yourself.
Two gates stand between Save and the commit:
-
The licence reminder dialog opens if the deployment does not hold a code-signing-capable licence. There is no way through this dialog other than upgrading the licence.
-
A confirmation dialog reads:
The web console will automatically restart after saving the SSO configuration. All active user sessions will be terminated. Do you want to continue?
Confirming writes the configuration and restarts the Console. Every signed-in user is booted to the login page, including you.
If the stored SSO configuration fails to load at application startup — for example because a provider secret was rotated without the Console being updated — the page shows a red banner on next open:
SSO Configuration Error! The SSO configuration could not be loaded during application startup and SSO is currently DISABLED.
When you see that banner, fix the misconfiguration, save again, and restart.
Operating tips
- Pilot with a single power user first. Flip one user's
Auth ModetoPassword & SSO, confirm they can sign in either way, then roll out across the team. - Keep at least one break-glass local account with
Auth Modeset toPassword. If the identity provider is unavailable, that account is your only route back into the Console. - Rotate provider secrets in the identity provider and the NetLock SSO page on the same day, and save with a small team warned — the restart is unavoidable.
- Document the provider's redirect URI and the NetLock account's
Auth Modesetting in your onboarding runbook. Most SSO support tickets arrive because one of those two was missed, not because the provider is actually misconfigured.
Troubleshooting common SSO failures
A handful of failure modes account for nearly every SSO incident. Recognising them early shortens the investigation:
- "User is not authorized for SSO login." — The account either does not exist with the expected username, or its
Auth ModeisPassword. Confirm the username on the NetLock account exactly matches the email claim the provider issues, and confirmAuth ModeisSSOorPassword & SSO. - Callback URI mismatch reported by the provider. — The redirect URI registered on the provider side does not match what the Console constructs. Re-derive the URI from
https://<public-host>/<callback-path>and register exactly that value at the identity provider, with no trailing slash differences. - Post-restart red banner on the SSO page. — The saved configuration could not be loaded at startup. A typical cause is a secret that was rotated at the provider but not updated in the NetLock SSO page, or an
Authority/InstanceURL that contains a typo. Fix the stored value and save again to retry the startup load. - Everything works except sign-out. — The
Signed Out Callback Pathis either missing or not registered at the identity provider. Add it in both places.
If the failure does not fit one of these, confirm the licence is still valid (Settings → Licensing, Chapter A.1.2) — SSO saves are gated on a code-signing-capable licence, and a lapsed licence disables further changes even if the previously-saved configuration continues to run.
Permissions
| Capability | Required flags |
|---|---|
View Settings → IP Whitelist | settings_enabled, settings_ip_whitelist_enabled |
View and save Settings → SSO | settings_enabled, settings_sso_enabled |
Related chapters
- How-to H.11 — Enable SSO with Azure AD / Google. Step-by-step walkthrough for the two most common providers.
- Chapter 14.2 — Creating a user, including the
Auth Modefield. - Chapter A.2.2 — Maintenance. Use a window to silence notifications during an IP or SSO change.
- Chapter X.3 — Troubleshooting. Covers common SSO callback and IP filter failure modes.
Globalisation
Settings → Globalisation at /settings/globalization configures how NetLock RMM formats dates and times across the Console. In the current release that is the only thing the page does — there is no language selector, no timezone selector, no number-format picker, and no first-day-of-week option. If you came here looking for one of those, skim this short chapter to confirm, then stop hunting.

A.5.1 The one field you can set
Date/Time Format is a dropdown with seven presets. A live preview renders directly beneath the dropdown, updating as you change the selection, so you can see the chosen format applied to the current date and time before saving.
| Preset label | Example |
|---|---|
| ISO | 2026-03-18 14:30:00 |
| EU | 18.03.2026 14:30:00 |
| UK | 18/03/2026 14:30:00 |
| US | 03/18/2026 02:30:00 PM |
| Textual month | 18 Mar 2026 14:30:00 |
| Slash ISO | 2026/03/18 14:30:00 |
| Dashed day-first | 18-03-2026 14:30:00 |
Pick the preset that matches your team's convention and click Save. The change is applied Console-wide immediately; a browser refresh is not required.
The selection is deployment-wide. There is no per-user date-format override and no per-tenant override, so choose a format your entire admin team is comfortable reading.
A.5.2 What this page does not configure
To save readers hunting for controls that are not here in the current release, the following are not configurable on this page:
- Language / UI locale. The Console's UI strings are not switchable from this page. Content displayed in the Console uses the language the build ships with.
- Timezone. Timestamps are presented in the Console host's local time. If your Console host is on UTC, timestamps are in UTC; if it is on a regional timezone, timestamps are in that zone. There is no override in this page.
- Number format. The Console uses the application's default numeric formatting; there is no thousands-separator or decimal-separator selector.
- First day of the week. Week-start conventions are not configurable.
- Currency. Currency formatting for reports and invoicing is not configured here.
If a deployment requires tighter control over any of these areas, that requirement is not met by the current release of the Console.
Permissions
| Capability | Required flags |
|---|---|
View and change Settings → Globalisation | settings_enabled, settings_globalization_enabled |
Related chapters
- Chapter A.2.2 — Maintenance. Scheduled maintenance windows are evaluated in server local time; the format chosen here only affects display.
- Chapter 12 — Events & Audit. Event timestamps are rendered using the format selected on this page.
Whitelabeling & themes
Settings → Whitelabeling at /settings/whitelabeling is where you replace the NetLock RMM default look with your own brand. The page controls the Console's logo, the login-page background, a forty-field colour palette split across light and dark modes, the browser-tab title, a welcome string on the login page, custom footer links, and the import / export of the whole theme as JSON. A separate Community Themes browser lets you pull in a pre-built theme or publish yours back to the community.

A.6.1 Scope — deployment-wide, not per-tenant
Whitelabeling applies to the whole deployment. There is no per-tenant branding. All administrators and all tenants see the same logo, the same colours, the same login page, and the same footer links. If you run NetLock RMM as an MSP and your customers sign into the Console directly, they all sign into the same branded Console.
If you operate as an MSP and need per-tenant customer-facing branding (a customer seeing their own logo when they sign in), that is not supported by this page in the current release. PDF report branding is managed separately in the Reports module (Chapter 11), and email notification branding is managed in the Notifications configuration (Chapter A.8).
A.6.2 Brand assets
Two image slots sit at the top of the page.
Web Console Logo
The Web Console Logo slot replaces the default NetLock RMM wordmark in the Console's top-left corner once you are signed in.
- Accepted formats: PNG or JPG.
- Maximum size: 2 MB.
- Recommended dimensions: 200 × 50 pixels.
- Upload: drag and drop onto the slot, or click to open a file picker.
A single logo is used across light and dark modes. There is no separate dark-mode logo upload. If your full-colour logo does not render well on a dark background, the practical workaround is to supply a version that works on both — for example, a white-on-transparent PNG with enough contrast in both modes — rather than maintaining two files. There is also no favicon upload on this page; the favicon is part of the build.
Login Page Background
The Login Page Background slot replaces the background imagery on the Console's unauthenticated sign-in page.
- Accepted formats: WEBP, PNG, JPEG, GIF, or MP4.
- Maximum size: 20 MB.
- Behaviour for video: an uploaded MP4 auto-plays, is muted by default, and loops continuously.
The background runs full-bleed behind the sign-in form, so pick imagery with enough contrast margin around the centre that the sign-in form remains legible. The larger size allowance reflects the fact that a good quality image or short loop can be several megabytes.
A.6.3 Colour palette — 40 fields across light and dark
The central portion of the page is the colour palette. NetLock RMM exposes 40 colour fields — twenty for light mode and twenty for dark mode, as mirrored pairs. Each field is a text input for a hex value (such as #1976D2) paired with a spectrum colour-picker widget, so you can pick visually or paste a hex value from your brand guide.
A short instruction sits above the fields:
Customize the color palette for both light and dark modes. Use hex color codes (e.g., #FF0000 for red).

Field categories
The twenty fields per mode cover the following categories. Rather than listing every individual field, think of them as groups:
- Brand accent colours:
Primary,Secondary,Tertiaryand theirContrast Textcounterparts. Use these for calls to action, selected states, and interactive accents. - Surfaces:
Background,Background Gray,Surface. Base page, panel, and card surfaces. - Semantic colours:
Info,Success,Warning,Errorwith theirContrast Textpairs. These drive alert banners, confirmation snackbars, validation errors, and similar feedback surfaces. - Text colours:
Text Primary,Text Secondary,Text Disabled. - Action colours:
Action Default,Action Disabled. Default icon and control tint in the neutral state. - Chrome colours:
Drawer Background,Drawer Text,AppBar Background,AppBar Text. The navigation rail and top bar.
The same categories appear in the dark-mode section with different values. You cannot have one palette apply to both modes; every mode carries its own set of twenty. That is usually what you want — a brand colour that looks good on a white surface rarely looks good on a near-black surface.
Choosing good values
A few practical tips:
- Do not leave
Contrast Textfields at defaults unless the default genuinely reads cleanly on your chosen brand colour. Low-contrast text is the most common failure mode of a fresh whitelabel. - Keep
BackgroundandSurfacesubtly different rather than identical, so cards read as cards. - Semantic colours (
Success,Warning,Error) should remain recognisable as their semantics. A green brand colour re-used asWarningconfuses users.
A.6.4 Text and footer customisation
Three text-facing sections sit alongside the palette.
Console title
Web Console Title is a plain text field. Its value appears in the browser tab and in the authenticated header. The default is NetLock RMM; replace it with your service name (for example, Acme MSP Console) to brand the browser tab and screenshots.
Welcome text
Welcome Text is the greeting string on the login page. Use it for a short welcome or a compliance notice — for example, Welcome to the Acme MSP Console. Authorised use only. Keep it short; the login page is not the place for a wall of text.
Custom footer links
The login-page footer is a configurable list of name-and-URL pairs. Each entry has:
Label— the text the user sees.URL (optional)— where the link points. If you leave this empty, the label renders as plain text rather than as a link — useful for small disclaimer strings in the footer area.
Two built-in toggles control whether NetLock RMM's own footer links appear:
Show built-in 'Support' linkShow built-in 'Documentation' link
Turn these off if your whitelabel replaces them with your own support and documentation URLs, on if you want users to reach the default NetLock RMM destinations.
A.6.5 Theme import and export
Once you have dialled in a palette, assets, and text, you can move the whole configuration between deployments as a JSON file.
Export
Export Theme downloads the full whitelabeling configuration as a versioned JSON file (for example whitelabeling-theme.json). The file contains:
- Web Console Title
- Logo (if set)
- Login Page settings (including the background)
- Theme Palette
- AppBar settings
- Particles configuration
- Fun Facts content
- Footer links
- Miscellaneous toggles
Keep the exported file as your brand backup. If a later edit goes wrong, re-importing the file restores the entire configuration.
Import
Clicking Import Theme opens the Import Whitelabeling Theme dialog. Pick a previously exported .json file. The dialog shows a preview of what is about to be applied:
- The console title from the file.
- A checklist of included components (logo, background, palette, appbar, particles, fun facts, footer links).
- Palette swatches so you can see the colours before you commit.
The dialog automatically downloads a backup of your current theme before applying the imported one:
Your current theme will automatically be downloaded as a backup before the import.
If the imported file is missing a component your current theme has, the missing component is skipped gracefully rather than overwriting your current value with blank. This means you can safely import a palette-only theme without losing your logo.
A.6.6 Community Themes
The Community Themes button opens a browser for pre-built themes shared by other NetLock RMM administrators, and is also the entry point for publishing yours back to the community.
Browsing and importing
The browse dialog supports a free-text search across name, description, and category, and a category filter with seven values:
Light ThemeDark ThemeCorporateMSPSeasonalHolidayOther
Theme cards show a preview screenshot, the theme name, its category, its maintainer, and an Official badge when the theme has been curated by NetLock RMM. If a video preview is provided, the card exposes a link to it.
Clicking a card opens the theme detail view. The detail view includes the full description, the creator's contact and homepage URLs, the video preview, the screenshot gallery, palette swatches, and a checklist of which components are included. The detail view's Import button runs the same auto-backup flow as a local JSON import — your current theme is downloaded first, then the community theme is applied on top.
Publishing your theme
The Publish to Community button opens a dialog for submitting your current theme to the community catalogue. The submission fields are:
| Field | Limit / note |
|---|---|
Theme Name | Required, up to 255 characters. |
Description | Up to 8000 characters. |
Category | Required; dropdown of the seven categories listed above. |
Contact | Optional, up to 255 characters. |
Homepage URL | Optional, up to 512 characters. |
Video Preview URL | Optional, up to 512 characters. |
| Screenshots | Up to three, 2 MB each. |
Beneath the metadata you pick which components are included in the publication:
- Logo — defaulted on if you have one set.
- Login Background — defaulted on if you have one set.
- Particles configuration — defaulted off.
- Fun Facts — defaulted off for privacy.
- Footer Links — defaulted off for privacy.
A note inside the dialog sets the non-negotiables:
Color palette and AppBar settings are always included. Iframe-embedding is never shared.
The palette is the substance of any theme, so it always ships; iframe-embedding settings are never shared because they are deployment-specific security configuration that should never travel between environments.
Published themes can be reported by other community members for moderation, and the Community Themes section follows the same moderation model as Community Scripts (Chapter 8.1) and Community Reports (Chapter 11).
A.6.7 Light / dark mode behaviour
Two mode selectors sit separately from the palette fields, because the palette defines the colours for both modes regardless of which mode is currently rendered.
Login Page Theme—system,light, ordark. Controls the login page's colour mode.Global Theme Mode—system,light, ordark. Controls the authenticated Console's colour mode.
When either is set to system, NetLock RMM follows the operating system's light / dark preference on the viewer's device. Setting one or both to an explicit light or dark overrides the system preference.
Community themes always ship both palettes — light and dark — so importing one never leaves you with a half-configured theme.
A.6.8 How changes take effect
The page shows an informational alert at the top:
Changes will be applied immediately after saving.
For colour palette changes specifically, a slightly different message appears:
Changes will be applied immediately after saving. The Login page may require a refresh to see the new colors.
In practice, the authenticated UI updates immediately after save for every signed-in administrator — a dedicated theme-update service pushes the new colours and assets to every connected session. The login page is cached more aggressively and may need a hard refresh (Ctrl + Shift + R, or Cmd + Shift + R on macOS) to pick up palette changes.
No Console restart is needed for any whitelabeling change. This is a rare page in the admin area that can be iterated on safely in the middle of the day without disrupting anyone.
A.6.9 Suggested workflow for a first whitelabel
A predictable first-pass flow keeps the exercise short:
- Gather your brand inputs first. Have the logo file, the background image or video, the six or so brand hex values, and the footer-link URLs to hand before you open the page. Iterating between this page and your brand assets folder is where most time goes.
- Upload the logo and background first. Get the top-of-page sections done and saved, so you have a visual frame to judge colours against.
- Start with the light-mode palette. Set
PrimaryandSecondaryfrom your brand guide, then work through the remaining light-mode fields. Do not leave contrast-text fields on their defaults — pick them explicitly. - Mirror the dark-mode palette. Do not simply copy the light values across; dark backgrounds typically need slightly lighter, more desaturated brand colours to read cleanly. Use the mode toggle (see A.6.7) to flip the Console into dark mode while you tune.
- Set the text fields. Console title, welcome text, footer links. Decide whether the built-in Support and Documentation links stay on.
- Export the theme as JSON. Keep the file as your brand backup. When you later want to propagate the theme to a second deployment (staging to production, or one tenant-of-yours to another of your deployments), you import the file rather than re-entering every value by hand.
- Save. Confirm that every signed-in admin sees the new look within a few seconds. Hard-refresh the login page in a private-browsing window to confirm the login colours also landed.
A first whitelabel pass done this way typically takes an hour; subsequent adjustments are a few minutes at a time.
A.6.10 What this page does not do
A short list to cap expectations:
- No per-tenant branding. Addressed above but worth repeating — all tenants see the same branding.
- No separate dark-mode logo. The logo is a single file used in both modes.
- No favicon upload. The favicon is part of the build.
- No email branding. Configured per notification channel (Chapter A.8).
- No PDF report branding. Configured in the Reports module's brand templates (Chapter 11).
- No granular font choice. The Console ships with its own typography; typefaces are not customisable here.
- No preview / draft mode. Every change takes effect immediately on save. Iterate in a staging deployment if you need a review cycle.
Permissions
| Capability | Required flags |
|---|---|
View and change Settings → Whitelabeling | settings_enabled, settings_whitelabeling_enabled |
Related chapters
- How-to H.12 — Brand the console (logo, colours, theme). Step-by-step walkthrough for first-time setup.
- Chapter 11 — Reports. PDF report branding is managed separately through report templates.
- Chapter A.8 — Notifications deep dive. Email branding is configured per channel there.
- Chapter 15 — Community. Context on how the Community features (Scripts, Reports, Themes) share a moderation model.
Remote screen control
The Remote Screen Control page at /settings/remote-screen is where a deployment operator decides whether remote control sessions are recorded, how long those recordings live on disk, and — when something needs reviewing — where those recordings are watched, downloaded, or deleted. It is an audit-and-compliance page, not a connection page.
Session transport itself — H.264 versus JPEG, relay versus SignalR, agent authentication — is covered in Chapter 3.5. Nothing on this admin page changes how sessions connect; it only controls what the server does with a recording once a session has ended.

A.7.1 Recording behaviour
Two controls drive the recording behaviour for the whole deployment.
Force session recording— a single toggle at the top of the page. When on, the Remote Server records every remote control session that any operator starts against any device. Recording cannot be declined by the operator and is not surfaced as a per-session option; the policy is deployment-wide. When off, no server-side recording is performed. The field description on the page reads "When enabled, all remote screen control sessions will be recorded by the server."Save— the toolbar action that persists the toggle. Changes do not apply to sessions already in progress; a recording started under the old setting continues to behave as it did when it began.
Note: The recording is produced by the Remote Server, not by the operator's browser. You do not need any client-side capture software, and the session being recorded does not reveal itself to the remote user any differently from an unrecorded session. Treat the toggle as a compliance decision: once it is on, every session is evidence, and every operator should be told so.
A.7.2 Retention and auto-purge
Recording indefinitely is rarely what compliance wants. Two fields manage lifetime:
Auto purge— a checkbox that enables automatic cleanup on a rolling window. When off, recordings are kept until an operator deletes them from the session browser.Older than X days— the retention window, in days. Recordings older than the chosen value are removed on the next purge cycle. Valid range on self-hosted deployments is1to9999days.
Cloud only: On cloud deployments, the retention window is fixed at seven days and the numeric field is hidden. The page shows the text "Your recordings will be kept for seven days." instead. To keep recordings longer on cloud, download the ZIP before the seven-day window elapses (see A.7.3).
Self-hosted operators have the whole range at their disposal, but two ends deserve a thought. Setting Auto purge with a value of 1 day is effectively "keep recordings only long enough to review them the same day they happen". A value of 9999 is effectively "forever" — at that point, budget disk space the same way you would for any long-lived evidence store, and review capacity periodically. The auto-purge loop walks the recording directories on the Remote Server and deletes any session folder whose age exceeds the threshold; nothing outside those directories is touched.
A.7.3 The recorded-session browser
The lower half of the page is a table of recorded sessions. It is not populated on page load — rebuilding the list on every render would scan every recording directory on every page visit, and those directories can be large. Instead the toolbar carries a Load Sessions action that triggers a one-time scan and fills the table.
Each row represents one recorded session, with three row actions:
View— opens the Recording Session Viewer, an in-Console playback dialog. Use this for quick review without copying the recording off the server.Download ZIP— packages the session's files into a zip archive and triggers a browser download. Use this when evidence has to leave the server — for an external auditor, a ticket attachment, or a long-term archive outside the retention window.Delete— opens a confirmation dialog and, on confirm, deletes the session directory. Deletion is immediate and not undoable. The auto-purge setting does not replace the button; operators still need manual delete for sessions they want gone sooner than the window allows.

If a session row is missing from the table after Load Sessions, check whether the session actually fell into the current retention window — auto-purge may already have removed it.
A.7.4 Interactions with other settings
- Connection transport. Chapter 3.5 documents the H.264 / JPEG and relay / SignalR choices. Neither affects whether a session is recorded; the
Force session recordingtoggle applies to sessions reached over any transport. - Maintenance mode. Maintenance mode suppresses notifications but does not suspend recording. A session started during maintenance is still recorded if the toggle is on. See A.2 for maintenance-mode semantics.
- Per-operator opt-out. None exists. Session recording is enforced at the server, not at the operator's workstation, so no client-side setting can bypass it.
Permissions
settings_enabled— access to theSettingsgroup at all.settings_remote_screen_enabled— access to this page's toggles and session browser.
Related chapters
- Chapter 3.5 — Remote control — how remote control sessions are established and what transports are available.
- A.2 — Updates & maintenance — maintenance windows and notification suppression.
- A.9 — Logging & protocols — for server-side logs that record the start and stop of each remote control session.
- A.12 — Content defaults — related Settings sub-pages in Part IV.
Notifications deep dive
The Notifications page at /manage_notifications is where every outbound alert leaves NetLock RMM. Five channels share the page as tabs — E mail, Microsoft Teams, Telegram, Ntfy.sh, and Webhook — and they all draw from the same event stream on the backend. This chapter documents each channel in depth, including the fields that differ between them, the test action, and the permissions that gate add, edit, delete, and test per channel.
If you only want a quick setup for the two most common channels, follow the How-To guide at H.10 — Configure email and Microsoft Teams notifications first and return here for the channels it does not cover.

A.8.1 The shared model
Every tab on the page shares the same mental model. Understanding it once makes every channel below self-explanatory.
Recipients are per-channel
Each channel manages its own list of recipients. There is no global "recipients" list that a channel subscribes to — an email address you add on the Email tab does nothing on the Telegram tab, and vice versa. Add the same inbox to every channel you want it to receive alerts on.
Severity filters on the recipient, not on the event
Every recipient record on every channel carries a Severity dropdown with five options: Any, Critical, High, Moderate, and Low. The match is exact — it is not a threshold and does not escalate. A recipient set to High receives High events only; it does not also receive Critical. The one value that crosses severities is Any, which delivers events of every severity. To send two specific severities — but not all — to the same destination, add that recipient once per severity, or use Any. Filtering happens on send, so a setting change affects future events only — events already dispatched are not re-evaluated.
Tenant scope via drag-drop
Every recipient record has two side-by-side lists — Tenants on the left, Selected tenants on the right — and a drag-drop control between them. Drag a tenant into Selected tenants to scope the recipient to that tenant. Leave Selected tenants empty to receive events from every tenant.
An operator only ever works with tenants they can see. If your role is restricted to one tenant, the Tenants list shows that one tenant and that is the only scope you can assign; administrators with wider access see every tenant and can drag any combination across.
The Uptime Monitoring toggle
Every channel has a toggle labelled Uptime Monitoring on every recipient record. The tooltip reads "If 'Disconnection Alert' is enabled in the device overview, the event is forwarded." That is the full behaviour: if the per-device Disconnection Alert flag (see Chapter 3.3) is on, device-uptime events will reach this recipient when the toggle here is also on. With the toggle off, uptime events bypass this recipient even if disconnection alerts are enabled on the device.
What the page does not expose
- No "event → channel" routing matrix. Which event types a recipient receives is determined by the recipient's exact severity filter and its tenant scope, not by a per-event-type switch.
- No "all channels at once" bulk editor. Each channel is edited independently.
- No deduplication across channels. If the same person receives an event by email and by Teams, they get two notifications.
With the shared model clear, the five tabs follow.
A.8.2 Email (SMTP)
The E mail tab is the first tab on the page. Two things live here: a single global SMTP configuration for the entire deployment, and a list of per-recipient email records.
The global SMTP configuration
Click SMTP settings on the Email tab toolbar to open the SMTP settings dialog. Exactly one SMTP configuration exists per deployment; editing it replaces the previous configuration for every email recipient.

Fields in the dialog:
Server— SMTP hostname.Port— SMTP port.SSL/TLS— checkbox. Tick if the server requires TLS.Username— SMTP authentication username. Some providers accept an email address here; others accept a distinct mailbox name.Password— SMTP password, with a visibility toggle next to the input.From address— sender address. This field is shown only whenUsernameis not itself a valid email address — some providers require an explicitFrombecause the login name is not a mailbox.To address— test-recipient address. Shown alongsideFrom addressunder the same condition, and used only by theTestaction.Test— button that runs a live send. The Console sends a message with subjectNetLock - Test Alertand bodyTest successful.to theTo address(or to the first email recipient if the conditional fields are not shown). A snackbar reportsTest successful.on pass orTest failed: <error>on failure.
The dialog's Confirm action is gated behind a successful test: you cannot save a configuration until Test has passed at least once in this dialog session. This is intentional — an untested SMTP record silently breaks every email recipient on the deployment.
Tip: For providers that require app-specific passwords (Microsoft 365 with security defaults, Google Workspace with 2-Step Verification, some business ISPs), generate the app password first, paste it into
Password, and leaveUsernameas the full email address. TheFrom addressandTo addressextra fields should stay hidden for these providers.
Email recipients
The recipient table on the Email tab is where individuals and mailing lists get added. Add, Edit, and Delete row actions manage entries; the dialogs behind them all share the same fields:
E mail— recipient address.Description— free text. Useful for listing a role ("On-call NOC engineer") rather than a person, so the row survives personnel changes.Severity— one ofAny,Critical,High,Moderate,Low.Uptime Monitoring— toggle (see A.8.1).Tenants/Selected tenants— drag-drop scope.
Multiple recipients are supported. There is no cap in the UI; the practical limit is how many addresses your SMTP provider is willing to accept before rate-limiting you.
Test an email recipient
The per-recipient Test action is on the row itself. It reuses the global SMTP configuration to send the same NetLock - Test Alert message but to the recipient's address rather than to the To address field. Use this after adding a new recipient to confirm delivery reaches them specifically.
A.8.3 Microsoft Teams
The Microsoft Teams tab hosts a list of incoming webhook connectors. Unlike SMTP, there is no global configuration dialog — each Teams channel you want to post to is its own connector row.

Fields per connector:
Connector Name— identifying name. Shown in test payloads and on notifications so recipients can tell which connector fired. Pick a name that describes the audience (NOC channel,Finance alerts) rather than the technology.Connector-Webhook-URL— the incoming webhook URL issued by Teams. The value is masked in the table view once saved, and revealable only in the Edit dialog. Create the webhook in Teams itself via the target channel's connector configuration; the URL contains the channel binding, so a rotated URL breaks the connector and requires re-saving.Description— free text.Severity—Any,Critical,High,Moderate,Low.Uptime Monitoring— toggle (see A.8.1).Tenants/Selected tenants— drag-drop scope.
Test a Teams connector
The row Test action POSTs a small JSON payload — {"text": "NetLock RMM Alert: Test.\nConnector Name: <connector_name>"} — to the connector's webhook URL. A snackbar reports Successfully sent on pass or Failed sending: <error> on failure. A successful send still requires you to open the Teams channel and verify the message arrived — Teams sometimes accepts a webhook call but filters the message out of the channel if the connector has been disabled or the channel archived.
Note: Microsoft has signalled deprecation of the classic Office 365 connector / incoming webhook format in favour of Workflows. The URL format supported by this channel is the classic incoming webhook. If Microsoft retires the format in your tenant, create a new connector with the updated URL and paste it over the
Connector-Webhook-URLfield; the row stays, only the URL changes.
A.8.4 Telegram
The Telegram tab configures one or more bot-to-chat pairings. Each row represents a single Telegram bot posting into a single chat or group.
Fields per bot:
Bot Name— display name for this bot configuration. Used in test messages and snackbar feedback; does not have to match the name you gave the bot in BotFather.Bot-Token— the Telegram Bot API token issued by BotFather. Password-masked in the table view; the dialog exposes a visibility toggle.Chat-ID— target chat or group ID. Private chats have a numeric positive ID; groups have a negative ID; channels have a-100…ID. Password-masked.Description— free text.Severity—Any,Critical,High,Moderate,Low.Uptime Monitoring— toggle.Tenants/Selected tenants— drag-drop scope.
Multiple bots are supported. It is common to run one bot per region or per severity tier and wire each to a different chat.
Test a Telegram bot
The row Test action sends the text NetLock RMM Alert: Test.\nBot Name: <bot_name> to the configured Chat-ID using the configured Bot-Token. A snackbar reports Successfully sent on pass or Failed sending: <error> on failure.
Tip: The most common cause of a failed Telegram test is that the bot has not been invited to the target group. Telegram bots cannot post into a group they are not a member of, even with a valid token and chat ID. Invite the bot first, then test.
A.8.5 ntfy.sh
The Ntfy.sh tab targets topics on ntfy.sh (or a self-hosted ntfy instance). Each row is one topic.
Fields per topic:
Topic Name— identifier / display name. Used in test messages and snackbar feedback.Topic URL— the full ntfy URL for the topic. The public default looks likehttps://ntfy.sh/<topic>, but any ntfy-compatible URL works, including self-hosted instances. Password-masked in the table view.Access Token— optional. When the topic requires authentication, paste a Bearer token here. The Console sends it asAuthorization: Bearer <token>on every outgoing request. Leave blank for public topics. Password-masked.Description— free text.Severity—Any,Critical,High,Moderate,Low.Uptime Monitoring— toggle.Tenants/Selected tenants— drag-drop scope.
Multiple topics are supported. The usual pattern is one topic per on-call team or one topic per severity tier.
Test a ntfy.sh topic
The row Test action POSTs the plain-text body NetLock RMM Alert: Test.\nTopic Name: <topic_name> to the Topic URL. A snackbar reports success or failure. Subscribers who have the ntfy app open with a subscription to the topic see the test notification arrive live.
Note: ntfy.sh is a push service, not a store. A notification sent before a subscriber opens the app on a fresh device is normally not replayed. For audit, rely on Events in the Console (see Chapter 12) rather than on ntfy history.
A.8.6 Webhook (notification channel)
The Webhook tab is the most flexible channel. Each row configures one outgoing HTTP call, with a freely-edited request body and header set.

Fields per webhook:
Name— identifier. Shown in the recipients table and in snackbar feedback.Description— free text.Severity—Any,Critical,High,Moderate,Low.Url— the target URL. Unlike the other password-style fields on this page, the URL is shown in the dialog in clear text so it can be reviewed and corrected without toggling visibility.Methode— HTTP verb. Dropdown withGET,POST,PUT,DELETE,PATCH. The label uses German-style spelling (Methode); it is the HTTP method field.Request Body— JSON template. Edited in a Monaco editor with syntax highlighting. Runtime substitution replaces placeholder tokens with event data just before the call is sent.Request Headers— JSON object. Defaults to{"Content-Type": "application/json"}. Edited in a Monaco editor. Keys and values are sent as HTTP headers on every call.Uptime Monitoring— toggle.Tenants/Selected tenants— drag-drop scope.
Placeholder tokens
Seven tokens are substituted into Request Body at send time:
| Token | Replaced with |
|---|---|
$netlock_tenant_name | Name of the tenant the event belongs to. |
$netlock_location_name | Name of the location the event belongs to. |
$netlock_device_name | Name of the device that produced the event. |
$netlock_date | Timestamp of the event, formatted per the deployment's date/time format (see A.5). |
$netlock_reported_by | Identifier of the subsystem or user that raised the event. |
$netlock_event | Short event type label. |
$netlock_description | Human-readable description of what happened. |
Tokens are substituted literally. If your downstream system expects one of them to be wrapped in quotes for JSON validity, write the quotes into the template — "tenant": "$netlock_tenant_name" rather than "tenant": $netlock_tenant_name.
Test a webhook
The Add / Edit dialog has a Test Webhook button; the row in the table also has a Test action. Both actions parse the stored JSON, validate the URL, and — if both are well-formed — send the call with the configured method, headers, and body. Validation failures surface as Invalid webhook URL. or Invalid JSON in Request Body.. A successful HTTP call produces a snackbar Webhook test successful! Status: <code>; a failed call produces Webhook test failed. Status: <code>. "Successful" here means the HTTP call completed and the server responded — a 4xx response still counts as a failed test from NetLock RMM's point of view.
A.8.7 Maintenance mode suppresses every channel
When maintenance mode is active on a tenant (see A.2), none of the five channels fire for that tenant's events. The events still accumulate — they are written to the event stream and are automatically marked as read once maintenance mode ends — so nothing is lost from the Console's history. What is suppressed is the outbound delivery. This applies uniformly to Email, Teams, Telegram, ntfy.sh, and Webhook; there is no per-channel maintenance-mode bypass.
Use this deliberately. A scheduled patch window with maintenance mode turned on for the affected tenant is quiet for operators and does not drown on-call channels in expected reboots. The trade-off is that a genuine incident that happens to coincide with the maintenance window is also suppressed, so keep maintenance windows tight.
A.8.8 The webhook channel is not the ticket webhook
NetLock RMM ships two distinct webhook systems. They share only the low-level HTTP send helper; everything else is separate.
| Notification webhooks | Ticket webhooks | |
|---|---|---|
| Configured on | Settings → Notifications, Webhook tab (this chapter) | Tickets → Departments, per-department webhook editor (Chapter 10.16) |
| Fires on | Global events (device uptime, website uptime, port scanner, antivirus, job, sensor) | Ticket events (ticket_created, sla_breached, etc.) |
| Tenant scoping | Drag-drop on the recipient record | Per department |
| Placeholder format | $netlock_* | {{ticket_number}}-style |
Pick the one that matches the event source. A request for "send every ticket update to Slack" is a ticket webhook; a request for "alert us when a device has been offline for ten minutes" is a notification webhook on this page.
A.8.9 Permissions
Every channel carries its own block of flags. A user without settings_enabled sees nothing in Settings; a user without settings_notifications_enabled sees no Notifications page at all; beyond that, each channel has independent add / test / edit / delete flags.
| Flag | Gates |
|---|---|
settings_enabled | Access to the Settings group. |
settings_notifications_enabled | Access to /manage_notifications and its tabs. |
settings_notifications_mail_enabled | Visibility of the E mail tab. |
settings_notifications_mail_smtp | Access to the SMTP settings dialog (Email-only sub-flag). |
settings_notifications_mail_add | Add a mail recipient. |
settings_notifications_mail_test | Test a mail recipient. |
settings_notifications_mail_edit | Edit a mail recipient. |
settings_notifications_mail_delete | Delete a mail recipient. |
settings_notifications_microsoft_teams_enabled | Visibility of the Microsoft Teams tab. |
settings_notifications_microsoft_teams_add | Add a Teams connector. |
settings_notifications_microsoft_teams_test | Test a Teams connector. |
settings_notifications_microsoft_teams_edit | Edit a Teams connector. |
settings_notifications_microsoft_teams_delete | Delete a Teams connector. |
settings_notifications_telegram_enabled | Visibility of the Telegram tab. |
settings_notifications_telegram_add | Add a Telegram bot. |
settings_notifications_telegram_test | Test a Telegram bot. |
settings_notifications_telegram_edit | Edit a Telegram bot. |
settings_notifications_telegram_delete | Delete a Telegram bot. |
settings_notifications_ntfysh_enabled | Visibility of the Ntfy.sh tab. |
settings_notifications_ntfysh_add | Add a ntfy.sh topic. |
settings_notifications_ntfysh_test | Test a ntfy.sh topic. |
settings_notifications_ntfysh_edit | Edit a ntfy.sh topic. |
settings_notifications_ntfysh_delete | Delete a ntfy.sh topic. |
settings_notifications_webhook_enabled | Visibility of the Webhook tab. |
settings_notifications_webhook_add | Add a webhook. |
settings_notifications_webhook_test | Test a webhook. |
settings_notifications_webhook_edit | Edit a webhook. |
settings_notifications_webhook_delete | Delete a webhook. |
The _smtp sub-flag on Email has no counterpart on the other channels — it exists because Email is the only channel with a single shared global configuration separate from the per-recipient records.
Related chapters
- H.10 — Configure email and Microsoft Teams notifications — end-to-end setup walk-through for the two most common channels.
- Chapter 10.16 — Ticket webhooks — the other webhook system, scoped to ticket events.
- Chapter 12 — Events & Audit — the event sources these channels dispatch.
- A.2 — Updates & maintenance — how maintenance mode suppresses every channel.
- A.5 — Globalization — date/time format used in
$netlock_date. - A.12 — Content defaults — sibling Settings admin pages.
Logging & protocols
Self-hosted only: The Logging page renders a standard "cloud team manages these" notice on cloud deployments and none of the three tabs below are shown. If you operate on cloud, your hosted operations team owns log retention, rotation, and review. The rest of this chapter describes the self-hosted experience.
The Logging page gives a self-hosted operator two things: a runtime switch to turn logging on or off for the Web Console and the Remote Server without a restart, and a built-in viewer for both log streams so you rarely need to SSH into a box just to tail a file. It is the triage surface for "something went wrong five minutes ago, where do I look?"
Two practical notes before the field-level reference.
- The page lives at
/logging, not at/settings/logging. It is administrative in nature but it is not grouped underSettingsin the URL hierarchy — you reach it fromNavigation → Loggingin the main nav, not from insideSettings. - The permission flag that gates this page is
settings_protocols_enabled, notsettings_logging_enabled. The UI label is "Logging" but the flag name is "Protocols" for historical reasons. When granting access in the role editor, look forsettings_protocols_enabledin theSettingssub-tree. The mismatch is listed in the Permission reference (X.2) so operators can find it when building roles.

A.9.1 The Settings tab
The first tab carries two independent runtime toggles. Both take effect immediately — no Console restart, no service restart.
- Web Console logging —
Enabled/Disabledtoggle. Controls log emission for the Console itself. A status chip readsActiveorInactive. The description under the toggle reads "Toggle logging for the web console at runtime. Changes take effect immediately without restart." Turning this off silences Console logs from that moment forward; previously-written log files are untouched. - Server logging —
Enabled/Disabledtoggle. Controls log emission for the Remote Server. The Console talks to the Remote Server's admin endpoint to query and flip this value: the current state is fetched from/admin/logging/statusand toggles are POSTed to/admin/logging/toggle. The description reads "Toggle logging for the NetLock RMM Server at runtime. Requires a valid connection to the server." If the Console cannot reach the Remote Server, the toggle is replaced by an error alert and the second toggle remains unusable until the connection is restored.
The two toggles are independent. It is common to turn Server logging on for a short window during agent-side troubleshooting while leaving Console logging at its normal state, and vice versa.
Note: Runtime toggles are convenience. The underlying services still honour the startup configuration on first launch — if a service starts with logging disabled in its config, it boots quiet until an operator flips it on from this page. The toggle state does not persist across service restarts unless your deployment's configuration file reflects it.
A.9.2 The Web Console Logs tab
The second tab is a live viewer for the Console's own log stream. It is the quickest place to look when a user reports a Console error — filter by severity, search by module or method, watch auto-refresh fill rows in real time.
The toolbar
A row of controls sits above the log table.
Log File— dropdown listing the five log files the Console maintains. Select one to view it:combined.log— every severity mixed together.debug.log— debug-only entries.info.log— informational entries.warning.log— warnings only.error.log— errors only.
- Severity filters — four checkboxes labelled
DEBUG,INFO,WARNING, andERROR. All default to on; untick a level to hide it. The severity filter is applied after the file is loaded, so it stays useful oncombined.logeven when the file is noisy. Search— a text input that filters the visible rows. The search covers every column: timestamp, severity, module, method, and message. Empty the input to show everything.Auto-Refresh— a toggle. When on, the viewer polls for new rows every three seconds and appends them to the bottom of the table.Reload— re-reads the selected file immediately. Use this after turning offAuto-Refreshor when you want to jump back to the top of the file.Download— downloads the selected log file. The download carries the raw file as the browser sees it, sodebug.logon disk becomesdebug.loglocally.
The table
Columns: Timestamp, Severity, Module, Method, Message. Severity is colour-coded so ERROR stands out against a crowded combined.log. Double-clicking a row opens the Log Entry Details dialog (see A.9.4), which shows the same fields plus the full untruncated message.

A.9.3 The Server Logs tab
The third tab is the Remote Server's counterpart to the Web Console Logs tab. Layout and controls are identical; three things differ.
- The log file dropdown is dynamic. Unlike the Console's fixed list of five files, the server's file list is fetched from the Remote Server on load, so whatever files the server currently maintains appear here. If the server introduces a new log file in a future release, it shows up automatically.
- The table has an extra
Linecolumn. Server log entries carry the source line number; Console log entries do not. The column appears betweenMethodandMessage. - The search covers the extra column. Search queries match against
Timestamp,Severity,Source,Module,Method,Line, andMessage.
A live connection to the Remote Server is required. If the server is unreachable, the tab replaces the viewer with an error alert, and both Reload and Auto-Refresh are unusable until the connection is restored. The Console does not cache server logs locally — closing and reopening the tab re-fetches — so a reachability issue means you see nothing rather than stale data.

A.9.4 The Log Entry Details dialog
Double-clicking any row in either log-viewer tab opens Log Entry Details, a read-only modal. Fields:
TimestampSeveritySource(Remote Server entries only; blank for Web Console entries)ModuleMethodLine(Remote Server entries only)Message— rendered in a wrapped code-style block so long stack traces and multi-line messages stay readable.
The dialog is read-only. Copying text out of it is the primary action; there is no edit, annotate, or forward affordance. Use the browser's copy shortcuts to pull the message into a ticket or a chat.
A.9.5 Routine operations
A short field guide for the most common tasks.
- Triage a user-reported Console error. Open
Logging → Web Console Logs, selecterror.log, set the search to whatever identifier the user gave you (username, route, time), and read the top match. If nothing matcheserror.log, retry oncombined.logwith the same search — some errors surface asWARNINGfirst. - Trace a failing agent operation. Turn on Server logging from the Settings tab, reproduce the failure, then open
Logging → Server Logsand filter by the affected device's name or hostname. Remember to switch logging back off when done to keep disk use down. - Collect logs for a support ticket. Use
Downloadon each relevant file in both tabs. Include the time window in the ticket so the reviewer knows what to look at. - Inspect a specific error. Double-click the row and copy the full message from the
Log Entry Detailsdialog — the table view truncates long messages.
A.9.6 What this page does not do
- No retention configuration. Log rotation and on-disk retention are handled by the hosting services' own configuration files, not by this page. See A.2 for maintenance-task coverage of log rotation.
- No log export to external SIEM. The page's only export action is
Download. For SIEM forwarding, wire a collector to the log directories directly on each host. - No remote-device logs. This page covers the Web Console and the Remote Server only. Agent-side logs are captured in each device's detail view (see Chapter 3.3).
Permissions
settings_enabled— access to theSettingspermission group (the page is underSettingsin the permission tree even though its URL is/logging).settings_protocols_enabled— access to the Logging page itself. Note the naming mismatch: the page is labelledLogging, the flag is namedProtocols.
Related chapters
- A.2 — Updates & maintenance — log rotation and maintenance tasks that touch log files.
- Chapter 3.3 — Device details view — agent-side logs, which are out of scope for this page.
- Chapter 12 — Events & Audit — event stream and immutable admin audit trail, distinct from the technical log files covered here.
- X.2 — Permission reference — full list of
settings_*flags, including thesettings_protocols_enablednaming note.
System settings
In most RMM products, "System Settings" is a single page that collects app-wide defaults in one place. NetLock RMM does not have that page.
A.10.1 Where to find each setting
Use the table below as a starting point. Pick the row that matches what you want to change and follow the cross-link to the chapter that documents it.
| What you want to change | Lives at | Documented in |
|---|---|---|
| Turn AI features on, configure the LLM provider, set API keys, set per-feature AI toggles | /settings/ai | A.11 — AI / LLM configuration |
| Restrict which database tables Dashboards, Reports, or Custom Fields can query; enable God Mode | /settings/dashboards, /settings/reports, /settings/custom-fields | A.12 — Content defaults |
| Configure notification channels (Email, Teams, Telegram, ntfy.sh, Webhook) | /manage_notifications | A.8 — Notifications deep dive |
| Enable the Ticket System, set ticket prefix, manage blocked attachment types | /settings/ticket-system | Chapter 10 — Tickets |
| Set the deployment's date/time format | /settings/globalization | A.5 — Globalization |
| Turn maintenance mode on/off, configure the update checker | /settings/maintenance, /settings/updates | A.2 — Updates & maintenance |
| Configure database connection, retention, backups | /settings/database | A.3 — Database management |
| Restrict Console access by IP address | /settings/ip-whitelist | A.4 — Security: IP whitelist & SSO |
| Configure SSO providers (OIDC / SAML) | /settings/sso | A.4 — Security: IP whitelist & SSO |
| Brand the Console (logo, colours, theme) | /settings/whitelabeling | A.6 — Whitelabeling & themes |
| Control remote-control session recording and retention | /settings/remote-screen | A.7 — Remote screen control |
| Toggle Web Console or Remote Server logging, view log files | /logging | A.9 — Logging & protocols |
| View system health, licensing, and seat usage | /settings/overview, /settings/licensing | A.1 — System overview & licensing |
If the setting you want does not appear in this table or under Settings in the navigation, it is probably not Console-configurable in the current release. Two cases to be aware of:
- Connection strings (MySQL, File Server, Remote Server URLs). Configured in
appsettings.jsonon the Console host. See A.1 for the read-only view. - Session timeout, password expiry, MFA enforcement policy. Not centralised. See Chapter 14 — Users & Roles for the authentication controls that do exist.
Permissions
The redirect target — /settings/overview — is gated by settings_enabled and settings_overview_enabled. A user who lacks settings_overview_enabled sees an access-denied response instead of landing on Overview.
Related chapters
- A.1 — System overview & licensing — the page the redirect lands on.
- Every other chapter in Part IV — see the routing table above.
AI / LLM configuration
The AI / LLM Settings page at /settings/ai is where a deployment operator chooses an AI provider, configures the connection, and decides which parts of the product the AI surfaces in. The page is OpenAI-compatible: it speaks the OpenAI chat-completions API shape, which means every provider that exposes that shape — OpenAI itself, Anthropic via its OpenAI-compatible endpoint, Ollama, LM Studio, LocalAI, and others — works from the same six fields below.
There is no NetLock RMM-managed AI. All inference happens at a provider you choose. That lets you keep everything on-premises with a local model if compliance requires, or hand it off to a hosted provider if throughput matters more. The trade-off is that every AI feature in the product depends on the provider you configure here being reachable and responsive.

A.11.1 The master toggle
Enable AI Features sits at the top of the page. It is the single switch that decides whether any AI-driven surface in the product is active.
- When off, every AI affordance across NetLock RMM is disabled. The AI Chat page is unavailable, AI buttons inside Scripts and Remote Shell are hidden, the
Analyze with AIbutton on Event Details is gone, and the AI Assistants inside the Add / Edit Sensor and Add / Edit Job dialogs are suppressed. Everything else in the product keeps working as normal. - When on, the specific AI surfaces that are active depend on the per-feature toggles below (see A.11.3).
Save persists the change. Toggling the master switch does not interrupt the provider configuration below; turning AI off and back on later restores whatever provider settings you saved last.
Tip: If you are not sure whether AI is the right fit for your deployment, turn the master toggle on, configure the provider, and leave every per-feature toggle at its default. Individual operators can then explore AI Chat (Chapter 13) before you broaden the feature exposure to the in-line buttons.
A.11.2 Provider configuration
Six fields describe the provider. Every AI call the Console makes uses them.
Provider Name— a free-text label that is shown in the Console wherever the provider identity matters (for example, on the AI Chat page header). Pick something operators recognise rather than the raw URL. Using the literal name of the service —OpenAI,Anthropic,Local Ollama— is usually the right choice.API Base URL— the root URL the Console appends chat-completions paths to. The helper text on the field readse.g., https://api.openai.com/v1. It must include the/v1segment if the provider expects it; the templates below populate this correctly for the four well-known providers.API Key— the secret used in theAuthorization: Bearerheader on every request. Password-masked input. For local providers that do not require authentication, the field still needs a non-empty value for some SDKs to function; providers vary, and most local setups accept any string.Model— the model identifier the provider expects in the chat-completions call. The helper text readse.g., gpt-4o, claude-sonnet-4-20250514, llama3. If you configure an identifier the provider does not recognise,Test Connectionsurfaces the provider's error directly.Max Tokens— the ceiling on the response length. Numeric input, range256to128000. The value should match what your chosen model and provider accept — a local model with a 4 000-token context window will not honour a128000setting. The default produced by the provider templates is4096.Temperature— the sampling temperature. Slider labelledTemperature: <value>with range0.0to2.0in steps of0.1. Lower values produce more deterministic output (0.0is effectively greedy decoding); higher values produce more varied output.0.7is a reasonable default for script analysis and event commentary, which is what the provider templates set.
Provider templates
Four one-click templates populate the fields with sensible defaults. Clicking a template overwrites whatever is currently in API Base URL and Model, resets Temperature to 0.7 and Max Tokens to 4096, and leaves API Key and Provider Name for you to fill in.
| Template | API Base URL | Model |
|---|---|---|
OpenAI | https://api.openai.com/v1 | gpt-4o |
Anthropic | https://api.anthropic.com/v1 | claude-sonnet-4-20250514 |
Ollama | http://localhost:11434/v1 | llama3 |
LM Studio | http://localhost:1234/v1 | local-model |
The page subtitle reads "any OpenAI-compatible provider". A provider that is not listed above — for example, LocalAI or a self-hosted vLLM — works by entering its API Base URL and Model manually. There is no separate "Custom" template because every configuration is custom at heart; the four named templates are just prefilled field sets.
Note: For Ollama and LM Studio, the template URL uses
localhost. That resolves to the host running the Console — not the host running your workstation, and not the host running the agent. If you run a local model on a different machine, replacelocalhostwith the reachable hostname or IP. If you run the Console in a container, make sure the container can reach the host's loopback if that is where the model lives.
Test Connection
The Test Connection button sends a minimal probe to the configured provider with the current field values. A spinner labelled Testing... displays during the call; the result is rendered inline below the button as either a success alert or an error alert with the provider's error text quoted.
Use Test Connection every time you change API Base URL, API Key, or Model. A saved configuration that has never tested successfully is a saved configuration that will silently fail every AI action in the product until you notice the first one fail.
A.11.3 Per-feature toggles
Five toggles below the provider section decide which AI surfaces are active in the rest of the product. Each defaults on once the master toggle is on — but you can narrow the exposure for rollout or policy reasons.
| Toggle | Where the surface appears in the Console |
|---|---|
Script Analysis | The AI Assistant button inside the Scripts editor. See Chapter 8.1. |
Remote Shell | AI suggestions and summarisation inside the remote shell surface. See Chapter 3.5. |
Event Analysis | The Analyze with AI button on the Event Details dialog. See Chapter 12. |
Sensor & Job Creation | AI Assistant buttons inside the Add / Edit Sensor dialog and the Add / Edit Job dialog. See Chapter 8.2 and Chapter 8.3. |
Event Log Analysis | AI buttons inside the Remote Event Log viewer. See Chapter 3.3. |
Turning a toggle off hides the surface wherever it appears; it does not break the feature the surface belongs to. Turning Script Analysis off still leaves the Scripts editor fully functional — you just do not see the AI Assistant affordance on it.
A common rollout pattern is to leave AI Chat on for all operators (it is the cheapest surface to evaluate), enable Script Analysis and Event Analysis for senior engineers, and keep Remote Shell AI off until the team is comfortable with the suggestions' quality.
A.11.4 Chat history cleanup
AI conversations started from the AI Chat page (see Chapter 13) are stored in the database. Two fields control how long they are retained.
Auto-cleanup chat history— toggle. When on, conversations older than the retention window are deleted on a rolling schedule. When off, conversations are kept until manually deleted from the AI Chat page.Keep chat history for X days— numeric, range1to9999. Disabled when the auto-cleanup toggle is off.
The auto-cleanup loop respects the toggle at runtime: turning the toggle off immediately stops the sweep; turning it on resumes on the next schedule tick. Clearing the retention window does not reset conversations that were already deleted — they are not recoverable.
Warning: Chat history can contain sensitive information operators pasted into the chat (credentials, internal hostnames, PII). If your compliance posture requires it, set a short retention window (7 or 14 days) from day one. Longer windows are defensible when there is a training or coaching use for older conversations.
A.11.5 What to verify after changes
A quick sanity loop after editing this page:
- Run
Test Connection. An inline success alert is the only confirmation the provider is actually reachable and the key, URL, and model all work together. - Open AI Chat (Chapter 13) and ask a one-line question. Confirm a reply arrives within a sensible time for the provider you chose.
- Visit one of the in-line surfaces whose toggle you enabled — the Scripts editor for
Script Analysis, Event Details forEvent Analysis— and confirm the AI button appears and produces output.
If step 1 passes but step 2 fails, the provider is reachable but the Chat-specific prompt is not being answered; check Max Tokens against the model's context window. If step 1 passes but step 3 fails, the per-feature toggle is off or the operator's role lacks the relevant feature-area permission.
Permissions
settings_enabled— access to theSettingsgroup.settings_ai_llm_enabled— access to theAI / LLM Settingspage.
Related chapters
- Chapter 13 — AI Chat — the primary AI surface for operators.
- Chapter 8.1 — Scripts — AI Assistant in the Scripts editor.
- Chapter 8.2 — Jobs and 8.3 — Sensors — AI Assistant in Add / Edit dialogs.
- Chapter 3.3 — Device details view — AI buttons in the Remote Event Log viewer.
- Chapter 3.5 — Remote control — AI in remote shell.
- Chapter 12 — Events & Audit —
Analyze with AIon Event Details. - X.5 — Integration endpoints — the full list of third-party endpoints NetLock RMM reaches out to, including LLM providers.
Content defaults
Three admin pages in the Settings group share a single purpose: deciding which parts of the MySQL schema are reachable from the Console's three SQL-aware content builders. The pages are Dashboard Settings, Report Settings, and Custom Fields Settings. They all look the same and do the same thing — they just apply to three different feature surfaces.
Because the pattern is identical across all three, this chapter describes the pattern once and then points at each page with the small details that differ (wording, storage, and which feature it governs). A separate fourth page — Ticket System Settings — is sometimes grouped with these by convention; it is a different kind of page and is cross-referenced at the end.
A.12.1 The common pattern
Every operator can tell what a content-defaults page does by looking at its two controls: a multi-select table list and a God Mode toggle.
The allowed tables list
A searchable checkbox list populated with every table in the NetLock RMM database. Two conveniences sit above it:
- A
Search tables...input that filters the list by name — useful when the schema runs to hundreds of tables. - A
Select Allcheckbox that selects every table currently matching the search filter. Clearing the search afterSelect Allleaves only the previously-filtered tables ticked, which is worth knowing if you intended to select every table in the schema.
The selected set drives the Visual Query Builder that the feature surface offers its end users. When a surface's query builder lists tables for the user to drag onto a canvas, this page is the authoritative list of which tables are offered. Tables that are not ticked here are not reachable from the Visual Query Builder at all; the user cannot browse, query, or join them.
The God Mode toggle
A single toggle below the table list flips the same feature surface from "pick from allowed tables" to "write any SQL". When God Mode is on, the feature surface exposes a raw-SQL editor in addition to (or sometimes in place of) the Visual Query Builder; the allowed-tables list becomes advisory rather than enforced. When God Mode is off, the query path honours the table list as a hard boundary.
The toggle label and help text differ slightly between the three pages — two call it "Enable God Mode (raw SQL queries)", one calls it "Enable God Mode (bypass table restrictions)" — but the behaviour is consistent: raw SQL with no table restriction.
Warning: God Mode lets users author queries against every table in the schema, including tables that hold credentials, secrets, and audit trails. Only enable it for features whose users you trust to write queries against the whole schema. Leaving the allowed-tables list in place and turning God Mode off is the safer default for most deployments.
How the two controls relate
| State | What the feature surface offers |
|---|---|
Tables selected, God Mode off | Visual Query Builder only, limited to the ticked tables. |
Tables selected, God Mode on | Visual Query Builder (limited to the ticked tables) plus a raw SQL editor (unrestricted). |
No tables selected, God Mode off | Visual Query Builder shows no tables — the feature surface is effectively read-only for most users. |
No tables selected, God Mode on | Visual Query Builder empty; raw SQL editor is the only path and is unrestricted. |
The "no tables, God Mode on" configuration is legitimate for deployments that only ever want raw SQL; the "no tables, God Mode off" configuration is rarely intentional — it usually means someone forgot to tick Select All after setting up the page for the first time.
A.12.2 Dashboards
Route: /settings/dashboards.
Purpose: Controls which tables appear in the Dashboard panel builder's Visual Query Builder. Panels on the Dashboard page pull data from SQL queries; this page decides which tables those queries can touch.
Info text at the top: "Select which database tables are available in the Dashboards visual query builder. Only selected tables can be queried by dashboard panels."
God Mode label: Enable God Mode (raw SQL queries).
God Mode help text: "When enabled, the Dashboards panel builder allows writing raw SQL queries instead of using the visual query builder. This bypasses query builder restrictions. Use with caution."

When a dashboard author opens the Panel Builder (see Chapter 2), the table picker inside the Visual Query Builder is populated from the set you tick here. Turning God Mode on adds a raw-SQL editor tab to the Panel Builder so authors who need one-off queries across the whole schema can write them.
Permissions: settings_enabled, settings_dashboards_enabled.
A.12.3 Reports
Route: /settings/reports.
Purpose: Controls which tables appear in the report widget SQL editor. Report widgets (see Chapter 11) pull data from SQL queries the widget author writes; this page decides which tables those queries can touch.
Info text: "Select which database tables are available in report widget SQL queries. Only selected tables can be queried by report widgets. This applies when God Mode is disabled."
God Mode label: Enable God Mode (bypass table restrictions) — slightly different wording from the other two pages.
God Mode help text: "When enabled, report widget SQL queries are not validated against the allowed tables list. Users can write any SQL query. Use with caution."

Reports have a stronger case for strict table restrictions than dashboards: reports are commonly scheduled and mailed out to a wide audience, so a query that accidentally pulls in a sensitive table can leak further than a one-off dashboard view would. Err on the side of a narrow allowed-tables list and turn God Mode on only for the users who author reports for senior technical audiences.
Permissions: settings_enabled, settings_reports_enabled.
A.12.4 Custom Fields
Route: /settings/custom-fields.
Purpose: Controls which tables appear in the Custom Field Builder's Visual Query Builder. Custom Field data sources include "SQL Select" (see Chapter 8.4); this page decides which tables those selects can touch.
Info text: "Select which database tables are available in the Custom Fields visual query builder. Only selected tables can be queried."
God Mode label: Enable God Mode (raw SQL queries).
God Mode help text: "When enabled, the Custom Fields builder allows writing raw SQL queries instead of using the visual query builder. This bypasses query builder restrictions. Use with caution."

Custom Fields are the page to tune most narrowly. Custom Field queries run on every matching device's detail page, often many times per day, and they surface in the UI with no "show me the query" affordance for end users. Keeping the allowed list limited to tables that are genuinely useful for device context — devices, events, jobs, sensors, custom-field data — is a good default; tables that hold tenant-wide or server-wide data rarely belong in a device-context Custom Field.
Permissions: settings_enabled, settings_custom_fields_enabled.
A.12.5 Ticket System defaults
The Ticket System has its own settings page at /settings/ticket-system with a different shape — module toggle, ticket number prefix, blocked file extensions, and Labels / Types / SLA tabs — and is documented with the rest of the ticket module in Chapter 10.2 and the sub-sections that follow. It does not fit the allowed-tables + God Mode pattern above, and it is not described again here to avoid drift between the two chapters.
If you are setting up a fresh deployment and working through the Settings menu top to bottom, visit Chapter 10 when you reach Ticket System. If you are only looking to enable the module, the single switch you need is Ticket System Enabled on the General tab at /settings/ticket-system.
A.12.6 Operational notes
A few cross-cutting reminders worth stating once:
- Changes take effect immediately for new queries. Queries already saved on existing dashboards, reports, and Custom Fields do not re-validate against a tightened allowed-tables list until they are re-edited. If you want to enforce a narrowed list retroactively, review the existing artefacts manually.
- Disabling a table does not disable existing data. A dashboard panel or Custom Field that queries a now-forbidden table continues to run until its next edit. Remove the offending panels or Custom Fields if that matters for your rollout.
- The three pages are independent. Ticking
eventson Dashboards does nothing for Reports or Custom Fields. Make the same set of choices across all three only if that is what you want.
Permissions
| Page | Flags |
|---|---|
| Dashboard Settings | settings_enabled, settings_dashboards_enabled |
| Report Settings | settings_enabled, settings_reports_enabled |
| Custom Fields Settings | settings_enabled, settings_custom_fields_enabled |
Related chapters
- Chapter 2 — Dashboard — the feature surface that Dashboard Settings governs.
- Chapter 11 — Reports — the feature surface that Report Settings governs.
- Chapter 8.4 — Custom Fields — the feature surface that Custom Fields Settings governs.
- Chapter 10.2 — Enabling the ticket system — the Ticket System settings page, which follows a different pattern.
- A.10 — System settings — routing guide for other
Settingsadmin pages.
Glossary
Alphabetical reference for terms that carry a specific NetLock RMM meaning. When a term is ambiguous in general IT usage, this glossary reflects what the product does, not what the word means elsewhere. Every entry points to the chapter that owns the subject in full.
A
Agent. The software installed on every managed device. It reports status, runs scheduled Jobs and Sensors, enforces the assigned Policy, and terminates remote-access sessions on the device side. Supported on Windows, Linux, and macOS. See Chapter 2 — Core Concepts and Chapter 3 — Devices.
AI Chat. The conversational surface at /ai-chat that operators use to ask an LLM about devices, events, or scripts, and optionally save generated scripts back into Collections. Off by default; configured under Settings → AI / LLM. See Chapter 13 and A.11.
App Hub. The software catalogue under Collections. Entries come from Winget (Windows), Flathub (Linux), Chocolatey, or manual scripted packages. The App Hub itself is a catalogue, not a deployment engine — actual installation runs through Software Deployment. See Chapter 8.5.
Application Control. The allowlisting feature under Collections. Rulesets define which applications may execute on Windows devices, matched by path, metadata, hash, or code-signing certificate. Rulesets attach to devices through Policy Settings → Windows → Application Control. See Chapter 8.6.
Audit. The immutable administrative trail at /audit. Every configuration change — user created, policy saved, automation edited — is recorded with the acting user, source IP, and timestamp. Distinct from Events. See Chapter 12.
Authorized device. A device that has been approved from the Unauthorized queue and now appears in the main inventory. Contrast with Unauthorized device. See Chapter 3.2.
Automation. A condition → policy rule. The condition matches a device attribute (Device Name, Tenant, Location, Group, Internal IP, External IP, or Domain) and the action assigns one named Policy. Automations are evaluated in priority order — first match wins. No event triggers, no schedules, no actions other than assigning a policy. See Chapter 5.
B
Brand template. A reusable cover-page, colour, logo, and PDF-footer bundle applied to generated Reports. Managed on the Brands tab of the Reports page. See Chapter 11.
C
Collection. The umbrella for eight reusable libraries — Scripts, Jobs, Sensors, Custom Fields, App Hub, Application Control rulesets, Device Control entries, and Software Deployments. You build library items once and reference them from Policies, Automations, or standalone actions. See Chapter 8.
Community. The integration layer that connects a deployment to the shared NetLock RMM catalogues of Scripts, Reports, and Whitelabeling themes. Not a standalone page — each community surface lives inside its parent feature. Authentication is deployment-level through a Members Portal API key. See Chapter 15.
Custom field. A per-device attribute defined in Collections. Field types are Text, Multiline, and Table. Data sources can be Manual entry, a parsed Job result, or a SQL query. Custom fields render as tabs and sections on the device detail page. See Chapter 8.4.
D
Dashboard panel. A widget on a Dashboard, backed by a SQL query. Panels are composed in the Panel Builder and constrained by the allowed-tables list in Settings → Dashboards. See Chapter 2 and A.12.
Department. In the Ticket System, a team-level container holding its own mailbox, operators, SLA defaults, templates, and webhooks. Every ticket lives in exactly one department. See Chapter 10.9.
Device. A managed computer — workstation, laptop, or server — that runs the Agent. Devices carry a hostname, a human-readable label, one Policy at a time, and any Custom Fields defined for the deployment. See Chapter 3.
Device Control. The USB-peripheral allowlisting feature under Collections. Entries match by vendor id, product id, serial, or device class, and scope to a device, tenant, location, group, or globally. New entries are created through the approval flow on the Blocked Devices tab, not a create dialog. See Chapter 8.7.
E
Events. The operational activity stream at /events. Events record things that happened on or to devices — script results, sensor breaches, policy deployments, antivirus detections. Contrast with Audit, which records configuration changes. See Chapter 12.
G
God Mode. A deployment-wide toggle that unlocks a raw-SQL editor inside a content surface. Three feature areas expose their own God Mode switches — Dashboards, Reports, and Custom Fields — each under its Settings sub-page. God Mode is a platform decision, not a per-user permission: when on, every user who can edit the feature can write unrestricted SQL. See A.12.
Group. The innermost level of the tenant hierarchy. A group belongs to exactly one location, which belongs to exactly one tenant. Groups are typically used to reflect device role or configuration rather than physical location. See Chapter 4.
J
Job. A Scripts-plus-schedule binding under Collections. A Job says "run this Script on the device on this trigger" — System Boot, a fixed Date/Time, a recurring interval, or recurring on named weekdays. A Job may be marked hidden, in which case it is excluded from Events and typically drives a Custom Field. Not to be confused with an operating-system scheduled task. See Chapter 8.2.
L
Label. A free-text display name for a device, editable per-device. The label replaces the hostname in Console lists, event feeds, reports, and audit entries. See Chapter 3.1.
Location. The middle level of the tenant hierarchy. A location belongs to exactly one tenant and contains one or more groups. Typically maps to a physical site. See Chapter 4.
M
Members Portal. The external identity and catalogue service that NetLock RMM uses for community features (Scripts, Reports, Themes). Authentication is deployment-level via a single API key stored in the Console settings. Individual operators do not sign in to the Members Portal. See Chapter 15.
P
Policy. A named bundle of desired device configuration — agent behaviour, tray icon, Windows Defender, Application Control, Device Control, Linux UFW, Sensors, Jobs, per-platform patch rollout, and App Hub exposure. A device is assigned at most one Policy at a time. No layering, no merging, no versioning, no rollback. See Chapter 6.
R
Relay. A server-side tunnelling service that lets the Console reach a device's TCP port through a relay connection when a direct connection is not possible. Used for Remote Control and for ad-hoc TCP forwarding. See Chapter 9.2.
Remote Control. The live screen-and-input session surfaced from the Console, delivered as H.264 video over the Relay when available and falling back to JPEG frames over SignalR when the Relay cannot carry the session. The product does not use VNC or RDP. See Chapter 3.5 and A.7.
Ruleset. In Application Control, a named list of rules that together form an allowlist for a set of devices. A ruleset is attached to devices through Policy Settings → Windows → Application Control. See Chapter 8.6.
S
Script. A snippet of PowerShell, Bash, Zsh, Python3, or MySQL stored in the Scripts library under Collections. Scripts run ad-hoc from the device detail page, on a schedule via Jobs, as the action of a Sensor breach, or from a remote shell. See Chapter 8.1.
Sensor. A per-policy metric collected by the Agent on an interval — CPU, memory, disk, an event log matcher, a ping, an SNMP probe, or the output of a script. Sensors carry severity-based thresholds for notification and for triggering an action Script. See Chapter 8.3.
Server. The central service the Console reads from and Agents report to. In a cloud deployment the vendor runs it; in a self-hosted deployment the customer runs it. See Chapter 1 — Core Concepts.
SLA. In the Ticket System, a response-and-resolution clock attached to a ticket through its priority and department. SLA states are Compliant, At Risk, and Overdue; thresholds are configured per priority. The Patch Management page uses the same three states against default thresholds (7 / 15 / 30 / 60 days by severity) for patch compliance. See Chapter 10.15 for tickets and Chapter 7.4 for patches.
Software Deployment. The packaged-deployment feature under Collections. A four-step wizard composes a target set and a sequence of App Hub entries to install, and the deployment tracks per-device attempt outcomes. The only direct path from the App Hub catalogue to installation on devices. See Chapter 8.8.
SSO. Single sign-on via OpenID Connect. Five providers are supported — Azure AD, Keycloak, Google, Okta, Auth0 — and exactly one can be active at a time. SAML 2.0 is not supported in the current release. See A.4.
T
Tenant. The top-level organisational container. For an in-house IT team it typically maps to the company itself; for an MSP it maps to one customer organisation. Tenants contain Locations, which contain Groups. See Chapter 4.
Ticket. The optional helpdesk unit of work. A ticket has a status, a priority, a department, a contact, an SLA clock, a conversation, a time-tracking log, and an audit trail. See Chapter 10.
Tray Icon. The small application the Agent exposes on Windows, Linux, and macOS devices to end users. Branding and visibility are controlled per-policy; the apps exposed in the tray menu are drawn from the App Hub selections on the policy. See Chapter 6.3.
U
Unauthorized device. A device whose Agent has contacted the Server but not yet been approved. Unauthorized devices sit at /unauthorized_devices until an operator authorises or rejects them. They do not appear in the main inventory. See Chapter 3.2.
W
Whitelist (Device Control). In Device Control, the allowlist of USB and peripheral devices permitted to attach to in-scope devices. The only creation path is the approval flow from the Blocked Devices tab. See Chapter 8.7.
Whitelabeling. The branding feature at Settings → Whitelabeling that replaces logos, colours, and accent text across the Console. Whitelabeling also hosts the Community Themes browser, which imports or publishes full themes. See A.6.
Permission reference
This appendix is the canonical catalogue of every permission flag NetLock RMM exposes to role configuration. Use it as a lookup when the User Settings matrix is too dense to navigate, when you are auditing an existing user's rights, or when you are designing a new role and need to see everything the product can gate.
For how to create a user and assign these flags, see Chapter 14 — Users & Roles.
X.2.1 The access model in one page
NetLock RMM has a flat, per-user permission model. Three things are worth internalising before you start assigning flags.
- No role templates. The
Rolecolumn on theUserslist is a free-text label — cosmetic metadata that appears in the list and in audit entries but grants no permissions by itself. Two users with the sameRolelabel can hold completely different flag sets. There is noAdministratortemplate that implies a permission set. Set flags one user at a time, or duplicate an existing user's flags by hand. - Permissions are boolean flags. Each flag is either granted or not granted. Access control is exercised through the matrix on
User Settings, where section-level switches enable a block and child checkboxes gate finer-grained actions within the block. Turning a parent switch off disables every child regardless of the child's stored value. - Tenant scoping is layered on top. Independent of flags, every user record holds a list of tenants they may act on. A user with every flag enabled but only tenant
Acmeselected sees and acts on devices, tickets, and events scoped toAcmealone. Global pages (Settings, Events, Audit, Users, Reports library) are not tenant-scoped; feature pages that operate on devices are.
Four specific facts shape how the flags below behave:
tickets_view_all_departmentsis a scope flag, not a feature flag. Users without it still see the Tickets page, create tickets, reply, and close tickets — but only on the department(s) they are assigned to. The flag widens their view across every department; it does not gate the ticket surface itself.settings_system_mysql_consoleis a sub-permission. The System settings group is unlocked bysettings_system_enabled, but the MySQL console that lives inside it takes a separate, narrower flag. Keep it off unless the user truly needs raw query access.ai_enabledis the global AI master. It gates whether any AI affordance in the product activates for the user. The individual surfaces (Script Analysis, Remote Shell AI, Event Analysis, Sensor & Job Creation, Event Log Analysis) are not per-user flags — they are deployment-wide toggles underSettings → AI / LLM. See A.11.reports_godmodeis not a user permission. Raw-SQL access in the Report Builder is a deployment-wide setting, managed underSettings → Reports. The same applies to God Mode for Dashboards and Custom Fields, each of which is configured on its own settings page and applies to every eligible user on the deployment. See A.12.
The remaining sections enumerate every flag.
X.2.2 Dashboard
| Flag | Gates |
|---|---|
dashboard_enabled | Access to the Dashboard page and the Panel Builder. |
X.2.3 Devices
| Flag | Gates |
|---|---|
devices_authorized_enabled | The main Devices list and device detail view. |
devices_general | The General tab on the device detail. |
devices_software | The Software tab on the device detail. |
devices_task_manager | The Task Manager tab. |
devices_antivirus | The Antivirus tab (Windows Defender). |
devices_events | The Events tab on the device detail. |
devices_updates | The Updates tab on the device detail. |
devices_remote_shell | The Remote Shell action. |
devices_remote_file_browser | The File Browser action. |
devices_remote_control | Remote Control — H.264 over Relay, JPEG over SignalR fallback. |
devices_remote_eventlog_viewer | The Remote Event Log viewer (Windows only). |
devices_remote_registry_editor | The Registry Editor (Windows only). |
devices_snmp_tools | The SNMP Tools dialog. |
devices_shutdown | The Shutdown command. |
devices_reboot | The Reboot command. |
devices_wake_on_lan | Wake on LAN. |
devices_force_sync | The Force Sync action. |
devices_deauthorize | The Deauthorize action — removes the device and returns its Agent to the Unauthorized queue. |
devices_move | Move a device between tenants, locations, or groups. |
devices_unauthorized_enabled | The Unauthorized Devices list at /unauthorized_devices. |
devices_unauthorized_authorize | The action that authorises a pending device. |
devices_world_map_enabled | The Device World Map. |
See Chapter 3 — Devices.
X.2.4 Tenants, Locations & Groups
| Flag | Gates |
|---|---|
tenants_enabled | The Tenants list. |
tenants_add | Create a tenant. |
tenants_manage | Open tenant detail. |
tenants_edit | Save tenant edits. |
tenants_delete | Delete a tenant. |
tenants_locations_add | Create a location. |
tenants_locations_manage | Open location detail. |
tenants_locations_edit | Save location edits. |
tenants_locations_delete | Delete a location. |
tenants_groups_add | Create a group. |
tenants_groups_edit | Edit a group. |
tenants_groups_delete | Delete a group. |
See Chapter 4 — Tenants, Locations & Groups.
X.2.5 Automations
| Flag | Gates |
|---|---|
automation_enabled | The Automations page. |
automation_add | Create an automation. |
automation_edit | Edit an automation. |
automation_delete | Delete an automation. |
X.2.6 Policies
| Flag | Gates |
|---|---|
policies_enabled | The Policies list. |
policies_add | Create a policy. |
policies_manage | Open Policy Settings for editing. |
policies_edit | Save changes in Policy Settings. |
policies_delete | Delete a policy. |
See Chapter 6 — Policies.
X.2.7 Patch Management
| Flag | Gates |
|---|---|
patch_management_enabled | The Patch Management page — all four tabs (Update Approval, Vulnerabilities, Update History, Settings). |
The page enables or disables as a whole; there is no per-tab flag. See Chapter 7 — Patch Management.
X.2.8 Collections
Master switch
| Flag | Gates |
|---|---|
collections_enabled | The top-level Collections navigation group. Every sub-feature below requires this flag and its own flag. |
Antivirus Controlled Folder Access
The UI for this feature is excluded from the current release. The flags still exist in the model and will apply if the UI ships in a future release.
| Flag | Gates |
|---|---|
collections_antivirus_controlled_folder_access_enabled | Access to the ACFA rulesets page. |
collections_antivirus_controlled_folder_access_add | Create an ACFA ruleset. |
collections_antivirus_controlled_folder_access_manage | Open an ACFA ruleset for viewing. |
collections_antivirus_controlled_folder_access_edit | Save edits to an ACFA ruleset. |
collections_antivirus_controlled_folder_access_delete | Delete an ACFA ruleset. |
collections_antivirus_controlled_folder_access_processes_add | Add a process to an ACFA ruleset. |
collections_antivirus_controlled_folder_access_processes_edit | Edit a process in an ACFA ruleset. |
collections_antivirus_controlled_folder_access_processes_delete | Remove a process from an ACFA ruleset. |
Application Control
| Flag | Gates |
|---|---|
collections_application_control_enabled | The rulesets page at /application_control_manage_rulesets. |
collections_application_control_add | Create a ruleset. |
collections_application_control_manage | Open a ruleset for viewing. |
collections_application_control_edit | Save edits to a ruleset. |
collections_application_control_delete | Delete a ruleset. |
collections_application_control_rules_add | Add a rule to a ruleset. |
collections_application_control_rules_edit | Edit an existing rule. |
collections_application_control_rules_delete | Delete a rule. |
See Chapter 8.6.
Device Control
| Flag | Gates |
|---|---|
collections_device_control_enabled | The whitelist and blocked-devices pages under /device-control. |
collections_device_control_manage | View the whitelist and the blocked-devices tab. |
collections_device_control_delete | Delete a whitelist entry. |
There is no _add flag — the only creation path is the approval flow on Blocked Devices, which is gated by the _manage flag plus the ability to act on the specific scope. See Chapter 8.7.
Sensors
| Flag | Gates |
|---|---|
collections_sensors_enabled | The Sensors page. |
collections_sensors_add | Create a sensor. |
collections_sensors_edit | Edit a sensor. |
collections_sensors_delete | Delete a sensor. |
See Chapter 8.3.
Scripts
| Flag | Gates |
|---|---|
collections_scripts_enabled | The Scripts page. |
collections_scripts_add | Create a script. |
collections_scripts_edit | Edit a script. |
collections_scripts_delete | Delete a script. |
See Chapter 8.1.
Jobs
| Flag | Gates |
|---|---|
collections_jobs_enabled | The Jobs page. |
collections_jobs_add | Create a job. |
collections_jobs_edit | Edit a job. |
collections_jobs_delete | Delete a job. |
See Chapter 8.2.
Custom Fields
| Flag | Gates |
|---|---|
collections_custom_fields_enabled | The Custom Fields page. |
collections_custom_fields_add | Create a custom field definition. |
collections_custom_fields_edit | Edit a definition. |
collections_custom_fields_delete | Delete a definition. |
See Chapter 8.4.
App Hub
| Flag | Gates |
|---|---|
collections_app_hub_enabled | The App Hub page. |
collections_app_hub_add | Add a manual app entry. |
collections_app_hub_manage | Edit, delete, or refresh catalogues. |
collections_app_hub_browse_winget | Browse the Winget catalogue. |
collections_app_hub_browse_flathub | Browse the Flathub catalogue. |
collections_app_hub_browse_chocolatey | Browse the Chocolatey catalogue. |
See Chapter 8.5.
Software Deployment
| Flag | Gates |
|---|---|
collections_software_deployment_enabled | The Manage Deployments page. |
collections_software_deployment_view | Open a deployment detail view. |
collections_software_deployment_add | Create a deployment. |
collections_software_deployment_manage | Cancel, retry, rename, clone, or delete a deployment. |
See Chapter 8.8.
X.2.9 File Server
| Flag | Gates |
|---|---|
file_server_enabled | The File Server page. |
file_server_add | Upload a file or create a folder. |
file_server_edit | Edit file metadata. |
file_server_delete | Delete a file or a directory. |
file_server_netlock | Access to the internal /netlock folder. Keep off for everyone except deployment operators. |
See Chapter 9.1.
X.2.10 Relay Server
| Flag | Gates |
|---|---|
relay_server_enabled | The Relay Server page. |
relay_server_manage | The Manage API Keys action. |
relay_server_add | Create a relay session. |
relay_server_edit | Enable or disable a persistent session. |
relay_server_delete | Close or delete a session. |
See Chapter 9.2.
X.2.11 Website Uptime Monitoring
| Flag | Gates |
|---|---|
website_uptime_monitoring_enabled | Access to the page. |
The page has one access flag; add, edit, and delete affordances on the page are controlled by the single _enabled flag. See Chapter 9.3.
X.2.12 Port Scanner
| Flag | Gates |
|---|---|
port_scanner_enabled | Access to the page and every action on it. |
See Chapter 9.4.
X.2.13 Events & Audit
| Flag | Gates |
|---|---|
events_enabled | The Events page. |
audit_enabled | The Audit page. |
The two are deliberately independent. Most operators need events_enabled; audit_enabled is usually reserved for security and compliance roles. See Chapter 12 — Events & Audit.
X.2.14 Users
| Flag | Gates |
|---|---|
users_enabled | The Users list. |
users_add | The Add User dialog. |
users_manage | Open User Settings for a user. |
users_edit | Save changes in User Settings, including the permission matrix. |
users_delete | Delete a user. |
A user who holds users_edit can edit every other user's permission flags, including their own. Treat this flag the way you would treat a root bit on Unix. See Chapter 14 — Users & Roles.
X.2.15 Reports
| Flag | Gates |
|---|---|
reports_enabled | The Reports page. |
reports_create | Create a report template. |
reports_edit | Edit a template. |
reports_delete | Delete a template. |
reports_generate | Run a one-off report generation. |
reports_schedules | Create or manage recurring report schedules. |
reports_brand_templates | Manage brand templates on the Brands tab. |
reports_godmode is not listed here — it is a deployment-wide toggle under Settings → Reports, not a user permission. See Chapter 11 — Reports and A.12.
X.2.16 Tickets
| Flag | Gates |
|---|---|
tickets_enabled | The Tickets module — the list, the detail view, Time Tracking. |
tickets_create | Create a ticket from the UI. |
tickets_edit | Edit ticket metadata in the Details tab. |
tickets_delete | Delete a ticket (hard delete — no recycle bin). |
tickets_assign | Change the assignee on a ticket. |
tickets_manage_departments | Manage departments. |
tickets_manage_templates | Manage response templates. |
tickets_manage_labels_types | Manage labels and issue types. |
tickets_manage_customers | Manage customer and contact records. |
tickets_manage_sla | Manage SLAs. |
tickets_view_time_tracking | The Time Tracking view. |
tickets_manage_webhooks | Manage per-department ticket webhooks. |
tickets_view_statistics | The Statistics view. |
tickets_view_all_departments | Scope flag. Widens the operator's view to every department. Without it, the operator sees only tickets on the department(s) they are assigned to. |
See Chapter 10 — Tickets.
X.2.17 Settings
Every flag below gates a specific Settings sub-page. The top-level Settings nav group requires settings_enabled; each sub-page requires its own flag in addition.
Access to the Settings group
| Flag | Gates |
|---|---|
settings_enabled | The Settings navigation entry. |
Overview & Licensing (self-hosted-only pages)
| Flag | Gates |
|---|---|
settings_overview_enabled | The Overview page. |
settings_licensing_enabled | The Licensing page. |
See A.1.
System & Maintenance
| Flag | Gates |
|---|---|
settings_system_enabled | The System settings sub-page. |
settings_system_mysql_console | The MySQL console embedded in System settings. Narrower than settings_system_enabled — grant only to operators who truly need raw query access. |
settings_maintenance_enabled | The Maintenance page. |
settings_maintenance_manage | Create or edit maintenance tasks. |
settings_protocols_enabled | The Logging page. The flag name is protocols for historical reasons; the Console labels the page Logging. See A.9. |
Updates & Database
| Flag | Gates |
|---|---|
settings_updates_enabled | The Updates page. |
settings_database_enabled | The Database management page. |
Security & Integration
| Flag | Gates |
|---|---|
settings_remote_screen_enabled | The Remote Screen defaults page. |
settings_ip_whitelist_enabled | The IP Whitelist page. |
settings_sso_enabled | The SSO configuration page. |
Customisation
| Flag | Gates |
|---|---|
settings_whitelabeling_enabled | The Whitelabeling page. |
settings_globalization_enabled | The Globalization page. |
settings_custom_fields_enabled | The Custom Fields settings page (allowed tables and God Mode for Custom Fields). |
Dashboards & Reports defaults
| Flag | Gates |
|---|---|
settings_dashboards_enabled | The Dashboards settings page (allowed tables and God Mode for Dashboards). |
settings_reports_enabled | The Reports settings page (allowed tables and God Mode for Reports). |
See A.12.
AI / LLM
| Flag | Gates |
|---|---|
settings_ai_llm_enabled | The AI / LLM configuration page. |
See A.11.
X.2.18 Notifications
The Notifications page has one master flag and five per-channel flag groups. Every channel follows the same pattern, with Email adding one extra flag for SMTP.
Master
| Flag | Gates |
|---|---|
settings_notifications_enabled | Access to the Notifications page. |
Per-channel pattern
For each channel <channel> in mail, microsoft_teams, telegram, ntfysh, webhook:
| Flag | Gates |
|---|---|
settings_notifications_<channel>_enabled | The channel's tab on the Notifications page. |
settings_notifications_<channel>_add | Create a recipient on this channel. |
settings_notifications_<channel>_test | Send a test to a recipient on this channel. |
settings_notifications_<channel>_edit | Edit a recipient on this channel. |
settings_notifications_<channel>_delete | Delete a recipient on this channel. |
Email extras
| Flag | Gates |
|---|---|
settings_notifications_mail_smtp | The deployment-wide SMTP configuration dialog. Separate from mail_edit — a user can manage recipients without being granted the ability to change the global SMTP server. |
See A.8.
X.2.19 AI
| Flag | Gates |
|---|---|
ai_enabled | The global AI master. When off, every AI surface in the product is hidden for this user regardless of deployment settings. |
ai_chat_page_enabled | The AI Chat page at /ai-chat. |
enduser_ai_accounts | The Customer AI dialog for managing end-user AI chat accounts — activation, per-user and per-tenant token limits, auto-activation, and statistics. Opened from the Tenants list and from tenant detail; scoped to the operator's tenants. See Chapter 13.6. |
The individual in-line AI surfaces (script analysis button, event-analysis button, sensor and job assistants, remote-shell AI, event-log AI) are enabled at the deployment level under Settings → AI / LLM — not per user. See Chapter 13 and A.11.
X.2.20 Designing a role
Because there are no templates, the pattern most deployments settle on is a handful of composed presets. As a practical starting point:
- Read-only observer —
dashboard_enabled,devices_authorized_enabled,devices_general,events_enabled,reports_enabled,reports_generate. - Level-1 technician — observer plus
devices_remote_shell,devices_remote_file_browser,devices_remote_control,devices_reboot,devices_force_sync,collections_enabled,collections_scripts_enabled,tickets_enabled,tickets_create,tickets_edit. - Level-2 engineer — L1 plus the
policies_*flags,automation_*, most of thecollections_*_add/_editflags,patch_management_enabled, andaudit_enabledfor incident review. - Deployment operator — L2 plus
settings_*_enabledfor the settings sub-pages they own,users_enabled/_add/_manage/_editif they onboard staff, and deliberately notsettings_system_mysql_consoleorusers_deleteunless strictly required.
Treat these as a sketch, not a policy. The shipped product has no saved role templates, so every deployment ends up writing its own catalogue.
Troubleshooting
This appendix lists the failure modes that generate the largest share of support traffic on NetLock RMM, with a short cause-and-fix for each. It is organised by surface rather than by error code — start from the area your symptom lives in.
Every entry below assumes a working baseline: you can sign in to the Console, the server process is running, and the database is reachable. When any of those are in doubt, check the Logging page first (see A.9) — almost every deeper problem surfaces there before it surfaces in the UI.
X.3.1 Agents and devices
The agent never appears in the Console after installation
Symptom. You installed the agent on a device, the installer reported success, but the device is not in the Devices list.
Likely cause. The agent is waiting in the Unauthorized queue. Unapproved devices do not appear in the main inventory by design.
Fix. Open Devices → Unauthorized Devices at /unauthorized_devices. Confirm the hostname, operating system, and the target tenant / location / group. Approve the entry. If the device is not in the Unauthorized queue either, see the next entry.
The agent does not show up even as unauthorized
Symptom. Installation completed but the device never reaches the Console — no entry in Devices, no entry in Unauthorized Devices.
Likely cause. The agent cannot reach the server. The three common reasons are a wrong server URL in the installer configuration, a network or firewall block between the device and the server, and TLS validation failure against the server certificate.
Fix. On the device, confirm the agent service is running (netlock_rmm_agent on Windows; the equivalent systemd unit on Linux). From the device, verify TCP reachability to the server URL and port. Check the server's own logs on the /logging page for rejected connection attempts — the source IP on the rejection is the device's apparent source IP, which is useful when a NAT or proxy is in the path.
A device reports Offline despite the agent running
Symptom. The device shows Offline in the Console, but the agent service is running on-device.
Likely cause. The sync interval on the device's policy is longer than you expected, the agent is running but unable to reach the server (intermittent network), or the agent crashed silently and did not restart.
Fix. Check the Agent tab on the device's assigned policy for the configured sync interval — valid values are 5 to 1440 minutes. Increase it only if you accept longer detection windows. Restart the agent service on the device; when the agent comes back up it emits a fresh check-in that moves the Console to Online. If the problem recurs, look at the agent logs on the device and at the server-side /logging page for the device's identifier around the transition window.
A device reports no_assigned_policy_found
Symptom. The device detail view shows no_assigned_policy_found in the policy field.
Likely cause. No automation's condition matches the device, so no policy has been selected for it. Policies do not attach to devices, locations, or groups directly — they route only through Automations.
Fix. Open Automations and review the list for a rule whose condition matches this device's attributes (Device Name, Tenant, Location, Group, Internal IP, External IP, or Domain). Create a new automation if none exists. Remember that automations evaluate in priority order and the first match wins — adjust priority if the wrong automation is matching. Automation changes force an immediate re-evaluation on every connected device. See Chapter 5 — Automations.
A policy edit has not taken effect on a device
Symptom. You edited a policy, saved, and the device has not picked up the change.
Likely cause. The device has not synced since you saved. Policy changes apply on the agent's next sync cycle.
Fix. If the delay is unacceptable, use the Force Sync action on the device detail page (requires devices_force_sync). Check the Events page for a deployment record — each policy deployment is logged and tells you which revision the device is on. If the device syncs but the change is still not visible on-device, duplicate the policy and re-assign through the automation; a corrupted stored policy is rare but not impossible.
X.3.2 Notifications
Email notifications never arrive
Symptom. Events that should trigger email stay silent; nothing arrives in the recipient's inbox.
Likely cause. The global SMTP configuration has not been saved with a passing test, a maintenance window is suppressing sends, or the recipient's severity threshold is filtering the events out.
Fix. Open Notifications → E mail → SMTP settings and re-run Test. The dialog's Confirm action is gated behind a passing test — a configuration that has never tested successfully silently breaks every email recipient on the deployment. Verify the recipient's Severity dropdown is set appropriately (Any delivers everything; Low delivers Low and above). Confirm no maintenance window is currently suppressing notifications. See A.8.2.
Microsoft Teams or ntfy.sh notifications do not arrive
Symptom. Teams channel is silent, or ntfy.sh topic shows no messages.
Likely cause. The connector URL or topic URL is wrong, the receiving service has rotated its identifier, or the recipient's tenant scope does not include the tenant the event belongs to.
Fix. Open the channel tab and run Test on the suspect recipient. Verify the connector URL (Teams) or topic URL (ntfy.sh) is still current on the receiving side. Check that the recipient's Tenants / Selected tenants scope includes the relevant tenant — an empty Selected tenants list means "all tenants", but a single selected tenant excludes events from others. See A.8.
X.3.3 SSO
SSO sign-in fails with "User is not authorized"
Symptom. A user completes the identity provider's sign-in flow but the Console rejects them with an authorization error.
Likely cause. The user has not been pre-provisioned in Users, their Auth Mode does not include SSO, or the email the identity provider returns does not match the username on the NetLock account.
Fix. NetLock RMM does not auto-provision accounts on first SSO sign-in. Open Users, create the account, set Auth Mode to SSO or Password & SSO, and make sure the Name field matches the email claim your provider returns exactly. Save. Ask the user to try again. See A.4.2.
Saving the SSO configuration restarts the Console
Symptom. You toggled SSO settings and saved, and the Console immediately restarted, booting every signed-in user.
Likely cause. This is expected. SSO configuration changes restart the Web Console so the new identity configuration loads cleanly.
Fix. No fix needed. Plan SSO changes during a maintenance window if the session churn is a concern, and confirm you can still sign in via the old method from a separate browser before you make the change, so you are not locked out if the configuration is wrong. See A.4.2.
SSO button missing on the login page
Symptom. The SSO tile does not appear on the sign-in page even though you configured a provider.
Likely cause. The deployment's licence lacks code-signing availability, or no provider is currently enabled. SSO requires a paid licence that surfaces License.CodeSigned.
Fix. Check the Overview and Licensing pages for licence state. If the licence is valid, re-open Settings → SSO, confirm exactly one provider tab has its Enable switch on, and save. Only one provider can be active at a time — switching one on turns the others off.
X.3.4 Remote control
Relay session stuck in Device offline state
Symptom. A relay session you initiated stays in an offline state indefinitely.
Likely cause. The device is genuinely offline, or the on-device Relay App is not running.
Fix. Confirm the device status on the Devices page first. If the device is online, the Relay App may be off or stuck — trigger a Force Sync on the device to reset its side of the relay connection. Check the Relay Server page for the session's state and for errors. See Chapter 9.2.
Remote Control falls back to JPEG over SignalR
Symptom. The remote control window shows lower-quality frames than usual, and the session indicator mentions SignalR rather than H.264.
Likely cause. The Relay's H.264 slots are all in use, or the Relay is unreachable — either case triggers the legacy fallback path that delivers JPEG frames over the Console's SignalR channel.
Fix. This is expected behaviour, not an error. If the lower quality is painful, wait for another session to end or free a slot by closing idle sessions on the Relay Server page. See A.7.
Remote Control disconnects on a device behind a strict corporate network
Symptom. The H.264 session connects, runs for a minute, and drops. JPEG fallback also drops.
Likely cause. A middlebox — firewall, proxy, or deep-packet-inspection appliance — is terminating long-lived WebSocket connections or the relay stream.
Fix. Verify the device can maintain persistent outbound connections to the server and relay. Review the middlebox's session-timeout policy for WebSocket traffic. If you control the relay, log into the relay host and check its own logs for the dropped session.
X.3.5 Collections
A custom field value does not populate on the device detail page
Symptom. A custom field renders but its value is blank or stale.
Likely cause. The Job that feeds the field failed on the device, or the Job has not run since the field was created.
Fix. Identify the Job feeding the field on Manage Custom Fields. Review its last execution on the device. If the Job is marked Hidden, its outcomes do not surface in the Events page — run it manually from the device detail page's Job list or from the Jobs management page to surface the failure. Fix the Job's Script or parse regex, then let it run again. See Chapter 8.4.
Application Control is not blocking an application I expected it to
Symptom. A user launched an application that is not whitelisted in any attached ruleset, and Application Control did not stop the launch.
Likely cause. The ruleset is not attached to the device's policy, the policy has not synced since the ruleset was attached, or Application Control itself is disabled on the policy.
Fix. Open Policy Settings → Windows → Application Control on the device's policy. Confirm the ruleset is attached and the master switch is on. Force-sync the device. If Application Control is attached and synced, check the Blocked Applications tab on the ruleset for the launch attempt — if the attempt is not recorded there either, the ruleset is probably not in enforce mode.
App Hub browse shows no apps for a catalogue
Symptom. The Winget, Flathub, or Chocolatey browser is empty.
Likely cause. The catalogue has not been refreshed yet on this deployment, or the server cannot reach the upstream service.
Fix. Click Refresh catalogs on the App Hub page. The refresh runs server-side and pulls the catalogue to the local database. Check /logging for network failures against the upstream catalogue. See Chapter 8.5.
X.3.6 Ticket System
Inbound emails are not creating tickets
Symptom. Customers reply to a department mailbox but no new tickets or replies appear.
Likely cause. The department's IMAP credentials are wrong, the mailbox is unreachable, or the Ticket System is disabled globally.
Fix. Open Tickets → Departments and review the department's mailbox configuration. Run the Test action. Check that Settings → Ticket System → General → Ticket System Enabled is on. Confirm the mailbox is reachable from the server. Note that Blocked File Extensions strips attachments during ingestion — it does not prevent the ticket from being created. If attachments are being stripped but the ticket still does not appear, the issue is not the blocklist.
Ticket list refreshes too slowly
Symptom. New replies arrive by email but the list lags behind.
Likely cause. The background refresh is on a 60-second cadence by design; the real-time toasts are a courtesy, not a replacement for the refresh.
Fix. Click Refresh on the page, or reload the page. If toasts are not arriving either, the Console's persistent connection has dropped — reload to re-establish it. See Chapter 10.3.
X.3.7 Dashboards, Reports, and content surfaces
A dashboard panel shows no data
Symptom. The panel renders but the value area is empty or shows zero.
Likely cause. The panel's SQL query returns no rows, the Visual Query Builder references a table that is not in the allowed-tables list, or God Mode is off and the panel relies on raw SQL that is now restricted.
Fix. Open the panel in the Panel Builder and check the underlying query. Open Settings → Dashboards and verify the referenced tables are ticked. If the panel needs unrestricted SQL, enable God Mode on the same page — but understand that God Mode is a deployment-wide switch that lets every eligible user write queries against the whole schema. See A.12.2.
A report generation fails with a SQL error
Symptom. Generating a report returns an error mentioning an unknown table or column.
Likely cause. Someone tightened the allowed-tables list in Settings → Reports after the template was written, or the schema changed between releases.
Fix. Add the missing table back to the allowed list on Settings → Reports, or edit the template to use only tables that are currently allowed. If the schema changed, duplicate the template and rewrite the query against the current columns. See A.12.3.
A Report Builder widget does not show the God Mode SQL field
Symptom. You expected a raw-SQL editor on a widget but only the Visual Query Builder is visible.
Likely cause. God Mode is off for Reports on this deployment. Raw-SQL editing is a platform-wide setting, not a per-user permission.
Fix. Open Settings → Reports and enable God Mode. The change applies to every user who can edit a report template from that moment.
X.3.8 When the answer is "look at the logs"
Two Console surfaces cover almost every deeper diagnostic.
- Logging at
/logging— the live viewer for Console and Server logs. Filter by severity, search by module, and watch lines appear as events happen. Self-hosted only. See A.9. - Audit at
/audit— the immutable record of configuration changes, including who changed what, from which IP, and when. When something used to work and now does not, the Audit log usually names the change that broke it. See Chapter 12.
Between them, they answer most of the "what changed and when" questions that otherwise turn into a hunt across multiple chapters.
Related chapters
Keyboard shortcuts
Short chapter because there is little to say. NetLock RMM's Console does not define global keyboard shortcuts.
X.4.1 There is no command palette
There is no product-wide keyboard binding to open a command palette, jump between pages, or focus the tenant selector. <kbd>Ctrl</kbd> + <kbd>K</kbd> does nothing. <kbd>Ctrl</kbd> + <kbd>P</kbd> triggers the browser's print dialog as usual — the Console does not intercept it.
X.4.2 There is no global dark-mode toggle
The theme toggle is on the Console header. Flip it there. The Console does not listen for a keyboard shortcut on dark mode, and does not honour a browser-level shortcut for it either. The preference you set in the header persists per user across sessions.
X.4.3 There is no dialog-close binding
Dialogs close with the Cancel or Close button. Some dialogs also respect the browser's standard <kbd>Esc</kbd> behaviour when focus is on a clearly dismissible element — but this is browser behaviour, not a Console feature, and it is not guaranteed across every dialog in the product. If a dialog refuses to close on <kbd>Esc</kbd>, use the button.
X.4.4 What keyboard handling does exist
Keyboard support is limited to page-local conveniences where a text field or form is the focus of the screen.
- Login page.
<kbd>Enter</kbd>submits the sign-in form when focus is on the password field. - Search fields. On pages with a search bar —
Devices,Events,Tickets,Manage Files, others — typing filters the list on the fly as each character is entered.<kbd>Esc</kbd>in the search field clears the filter. - Table search inputs. On the content-defaults pages (
Settings → Dashboards,Reports,Custom Fields), theSearch tables...input filters the checkbox list as you type. - Monaco editor. The script editor on the
Scriptspage is an embedded Monaco instance. It inherits Monaco's own keyboard bindings for code navigation, find (<kbd>Ctrl</kbd> + <kbd>F</kbd>), replace (<kbd>Ctrl</kbd> + <kbd>H</kbd>), and multi-cursor editing. None of these are a product-defined binding — they come with the embedded editor. - Remote control window. The remote control surface binds keys so that modifier and function keys pressed in the window are forwarded to the remote machine rather than intercepted by the browser or the host OS. This is session-local and specific to that window.
- Remote shell window. Standard terminal keyboard behaviour, including
<kbd>Ctrl</kbd> + <kbd>C</kbd>for interrupt and<kbd>Tab</kbd>for completion, works inside the embedded terminal.
X.4.5 Why the list is short
Web applications that expose rich keyboard navigation usually do so through a command-palette pattern or a published shortcut map. NetLock RMM has neither in the current release. The Console is built to be operated with a pointer and the occasional typing shortcut on text fields — which matches how most operators use it in practice.
If the lack of shortcuts is a blocker for accessibility or productivity, raise it as a feature request. The underlying UI framework supports programmatic focus and keyboard hooks, but no deployment-wide bindings are wired up in the current release.
Integration endpoints
NetLock RMM is designed to fit into an existing operations stack rather than replace it. This appendix lists every external system the product talks to, what the integration is for, and where in the Console it is configured. Use it as a firewall-review checklist and as a quick index when you need to find "where do I plug in the X credentials?".
Every row points to the chapter where the integration is documented in depth. The configuration column names the Console page that owns the credentials.
X.5.1 Community and catalogues
Three upstream services feed Collections with content you can pick from or publish into.
| Endpoint / Service | Purpose | Configuration home |
|---|---|---|
| GitHub | Source for Community Scripts. The Scripts library pulls community-published scripts from a GitHub-backed catalogue and can publish local scripts back. | Chapter 8.1 — Scripts. |
| Winget | Windows package catalogue exposed inside App Hub. A deployment-level Refresh catalogs action syncs the latest catalogue into the Console. | Chapter 8.5 — App Hub. |
| Flathub | Linux package catalogue exposed inside App Hub. Refreshed together with Winget and Chocolatey. | Chapter 8.5 — App Hub. |
| Chocolatey | Secondary Windows package catalogue exposed inside App Hub. | Chapter 8.5 — App Hub. |
Each App Hub catalogue is server-side — the refresh runs on the server, not in the operator's browser. Outbound network reachability to the relevant catalogue is therefore a server firewall concern, not a workstation one.
X.5.2 Notification channels
Five channels on the Notifications page reach outbound destinations. Every channel is independently configurable and every recipient carries a severity filter and a tenant scope.
| Endpoint / Service | Purpose | Configuration home |
|---|---|---|
| SMTP (any provider) | Email notifications. Global SMTP configuration plus per-recipient addresses. | A.8.2 — Email (SMTP). |
| Microsoft Teams incoming webhook | Post alerts to a Teams channel. One connector per channel. | A.8.3 — Microsoft Teams. |
| Telegram Bot API | Send alerts to a Telegram chat or group via a bot token. | A.8 — Notifications deep dive. |
| ntfy.sh (or self-hosted ntfy) | Push notifications to phones and desktops via topic URL. | A.8 — Notifications deep dive. |
| Generic webhook (notifications) | Arbitrary HTTPS POST per event. Use it to feed a SIEM, a ChatOps pipeline, or any service that accepts JSON. | A.8 — Notifications deep dive. |
Each channel has its own Test action that sends a probe. A configuration that has never passed its test is a configuration that silently drops every event until the first failure is noticed — run the test on every channel immediately after setup.
X.5.3 Ticket System webhooks
Separate from the notification webhooks above, the Ticket System has its own per-department outbound webhook surface.
| Endpoint / Service | Purpose | Configuration home |
|---|---|---|
| Generic webhook (tickets) | Per-department HTTPS POST fired on ticket lifecycle events (created, replied, resolved, closed). One webhook per department, with per-event toggles. | Chapter 10.16. |
Ticket webhooks follow the same URL + secret + events shape as the notifications webhook but draw from a different event stream. They also require the tickets_manage_webhooks flag.
X.5.4 Identity providers
One SSO provider can be active at a time. All are OpenID Connect — SAML 2.0 is not supported in the current release. The same configuration page hosts tabs for each.
| Endpoint / Service | Purpose | Configuration home |
|---|---|---|
| Azure AD (Microsoft Entra ID) | OIDC sign-in for Azure-federated organisations. | A.4.2 — Single Sign-On. |
| Keycloak | OIDC sign-in backed by a self-hosted Keycloak realm. | A.4.2 — Single Sign-On. |
| Google (Workspace / Identity) | OIDC sign-in for Google-federated organisations. | A.4.2 — Single Sign-On. |
| Okta | OIDC sign-in for Okta tenants. | A.4.2 — Single Sign-On. |
| Auth0 | OIDC sign-in for Auth0 tenants. | A.4.2 — Single Sign-On. |
Saving SSO configuration restarts the Web Console — plan the change during a maintenance window.
X.5.5 AI / LLM providers
The AI / LLM configuration speaks the OpenAI chat-completions shape. Any provider that exposes that shape works.
| Endpoint / Service | Purpose | Configuration home |
|---|---|---|
| OpenAI | Hosted GPT models via https://api.openai.com/v1. | A.11.2 — Provider configuration. |
| Anthropic (OpenAI-compatible endpoint) | Claude models via the OpenAI-compatible endpoint at https://api.anthropic.com/v1. | A.11.2. |
| Ollama | Local model runtime, usually reached on http://localhost:11434/v1. | A.11.2. |
| LM Studio | Local model runtime, usually reached on http://localhost:1234/v1. | A.11.2. |
| Any OpenAI-compatible provider | LocalAI, vLLM, self-hosted OpenAI-compatible gateways. Enter the provider's API Base URL, API Key, and Model manually. | A.11.2. |
localhost in the local-model templates resolves to the host running the Console — not the host running the operator's workstation, and not a device running the agent. Adjust the base URL when the model runs on a different machine.
X.5.6 Members Portal and vulnerability data
Two infrastructure endpoints that underpin community features and patch management.
| Endpoint / Service | Purpose | Configuration home |
|---|---|---|
Members Portal API (https://api.members.netlockrmm.com) | Deployment-level authentication and distribution for community features — Community Scripts, Community Reports, Community Themes. A single API key is stored on the deployment; every operator inherits it. | Chapter 15 — Community. |
| NVD (National Vulnerability Database) | Source of CVE data shown on the Patch Management → Vulnerabilities tab. The Auto-download toggle refreshes the local copy on a schedule. | Chapter 7.5 — Vulnerabilities. |
X.5.7 Outbound firewall checklist
For a self-hosted deployment, the server needs outbound HTTPS to every endpoint above that the deployment actually uses. A starter checklist:
api.members.netlockrmm.com— for any community feature.services.nvd.nist.gov(and its redirects) — for NVD downloads.- The catalogue hosts for Winget, Flathub, and Chocolatey — only for App Hub refreshes.
- The identity provider's OIDC discovery and token endpoints — only for SSO.
- Each notification destination — SMTP gateway, Teams connector host, Telegram API, ntfy.sh (or your self-hosted ntfy), and whatever your generic webhooks target.
- The LLM provider's base URL — only if AI features are enabled.
Cloud deployments delegate this connectivity to the hosted operations team; only the notifications and LLM endpoints remain the customer's firewall concern.
Related chapters
- Chapter 8 — Collections — Scripts, App Hub, and the upstream catalogues.
- Chapter 10 — Tickets — department webhooks.
- Chapter 15 — Community — Members Portal API key.
- A.4 — Security: IP whitelist & SSO.
- A.8 — Notifications deep dive.
- A.11 — AI / LLM configuration.
Changelog pointer
This manual does not duplicate release notes. Release-by-release detail lives in two places.
X.6.1 The in-app Changelog dialog
The Console ships with a Changelog entry in the header's help menu. Opening it surfaces a dialog that lists recent changes per release — new features, noteworthy fixes, and any migration notes that apply in place. It is the fastest way to answer "what changed in the version I am running?" without leaving the Console.
See Chapter 1.4 — Navigating the Console for where the Changelog entry lives in the header. The dialog is available on every page.
X.6.2 Update availability
When a newer Console or server version is available, an Update available item appears alongside the Changelog entry in the same header menu. Clicking it opens a short summary and a link into the update flow. On self-hosted deployments the operator drives the update; on cloud deployments the hosted team applies updates centrally.
See A.2 — Updates & maintenance for the self-hosted update procedure, including pre-update checks and rollback considerations.
X.6.3 The published changelog
The authoritative, searchable changelog for published releases lives on the NetLock RMM website. If the in-app Changelog has been truncated, or if you need to trace the history of a feature across several releases, consult the website version. The website also lists release notes for versions older than those cached in the in-app dialog.
When in doubt, treat the website changelog as the canonical source and the in-app dialog as a convenience.
X.6.4 What this manual treats as versioned
This manual describes the current release of NetLock RMM. Where a feature is known to have changed behaviour in a recent version, the chapter documenting it carries a short note. When a feature referenced in this manual is missing from your Console, check the Changelog — the most likely explanation is that you are on an older release where the feature had not yet shipped.
Related chapters
Feature Matrix
This appendix is a single-page index of what NetLock RMM does. It groups every feature into Console, server, and agent areas, records platform support where it varies, and links to the chapter that documents the feature in full. Use it to answer "does the product do X, and where do I read about it?" — not as a configuration reference. For mechanics, follow the cross-links.
Three conventions apply throughout:
- Yes / No in a platform column means the feature is or is not available on that operating system.
- A dash (
—) means the feature does not apply to that platform. - Where a column names a tool or shell instead of Yes (for example
PowerShell), that is the platform-specific implementation.
Note: This matrix summarises shipped behaviour. When a feature area carries deployment-specific or licensing-specific limits, the linked chapter is authoritative.
X.7.1 Console features
The web Console is the single operator surface. The features below are available regardless of agent platform; they are properties of the Console itself.
| Feature | Summary | Documented in |
|---|---|---|
| Multi-tenancy | Tenant, location, and group hierarchy for organising devices. | Chapter 4 |
| Users and roles | Per-user, permission-gated access; tenant-scoped visibility. | Chapter 14 |
| Two-factor authentication | Time-based one-time password (TOTP) on operator accounts. | Chapter 14 |
| Single sign-on | OpenID Connect with Azure AD, Google, Keycloak, Okta, or Auth0; one provider active at a time. | A.4 |
| IP whitelist | Restricts Console access to named networks. | A.4 |
| Dashboard and Panel Builder | Per-user dashboards with chart and table panels driven by a visual or raw SQL query builder. | Chapter 2 |
| Setup Wizard | First-run guided setup shown on the Dashboard. | Chapter 2 |
| Events browser | Operational event stream, filterable by severity, type, scope, device, and time. | Chapter 12 |
| Audit log | Immutable record of administrative actions in the Console. | Chapter 12 |
| Notifications | Email, Microsoft Teams, Telegram, ntfy.sh, and webhook channels. | A.8 |
| Reports | Pre-built and custom reports, brand templates, and scheduled delivery. | Chapter 11 |
| Custom fields | Operator-defined device-detail tabs, sections, and fields. | Chapter 8.4 |
| File Server | Stores files for distribution; files can be referenced from scripts. | Chapter 9.1 |
| AI Chat and assistants | Optional LLM features for chat and per-feature assistance. | Chapter 13, A.11 |
| Customer AI (end-user chat) | Optional end-to-end-encrypted AI assistant for end users in the agent tray, with per-user and per-tenant token limits. | Chapter 13.6 |
| Ticket System | Optional helpdesk: departments, SLAs, time tracking, templates. | Chapter 10 |
| Device World Map | Plots managed devices by IP geolocation. | Chapter 3 |
| Maintenance mode | Manual and scheduled windows that suppress outbound notifications. | A.2 |
| Database management | Per-table retention, cleanup, and an optional SQL console. | A.3 |
| Localization | Language, timezone, and date-format settings. | A.5 |
| Custom Installer and Agent Download | Generates command-line configs and one-click installers for Windows, Linux, and macOS. | Chapter 3 |
| Whitelabeling | Branding of logos, colours, login page, and Console chrome. | A.6 |
| Community catalogues | Shared Scripts, Reports, and Themes through the Members Portal. | Chapter 15 |
Optional module: The Ticket System applies only when it is enabled in
Settings → Ticket System. See Chapter 10.
The AI features are optional and require an LLM provider to be configured (see A.11). Two kinds exist: the general-purpose AI Chat page, and targeted per-feature assistants. The targeted integrations are the AI Assistant in the Scripts editor (which writes directly into a script), the AI Assistant on the Automations dialogs, the AI SQL Assistant in the Widget Editor, and the Analyze with AI action on event and audit details (which opens AI Chat with the entry pre-filled). See Chapter 13.
A separate, optional Customer AI feature extends AI to end users: when enabled in the tray-icon policy, staff open an AI chat directly from the agent's tray icon. Conversations are end-to-end encrypted on the device — the server stores only ciphertext and operators never see message content. Accounts self-register and are activated by an operator (or auto-activated per tenant), and usage is bounded by per-user and per-tenant monthly token limits. Operators manage these accounts from the Customer AI dialog on the Tenants pages, gated by the enduser_ai_accounts permission. See Chapter 13.6.
Whitelabeling options
Whitelabeling is broad enough to list separately. Each option below is configured under Settings → Whitelabeling and documented in A.6.
| Option | Summary |
|---|---|
| Console title and logo | Custom title text and a custom logo image. |
| Login page layout | Centred-card or side-panel layout with toggles for logo, glow, and fun facts. |
| Login page background | Custom background image or video. |
| Welcome text and footer links | Custom greeting and custom footer links on the login page. |
| AppBar and navigation | Per-icon AppBar visibility and a collapsed-drawer mode. |
| Visual effects | Optional seasonal overlays and particle backgrounds. |
| Colour palette | A full light-mode and dark-mode colour palette with live preview. |
| Iframe embedding | Allows or blocks embedding the Console in third-party applications. |
| Theme import, export, and community themes | JSON theme exchange and a community theme gallery. |
X.7.2 Server features
The server is the central service the Console reads from and agents report to. Self-hosted operators run it themselves; cloud operators do not.
| Feature | Summary | Documented in |
|---|---|---|
| Role-based deployment | The backend can be split into separate server roles. | A.1 |
| Agent handshake | Only agents issued by your own deployment can communicate with your backend. | A.1 |
Self-hosted only: Server architecture and role splitting apply to self-hosted deployments. Cloud deployments delegate server operation to the hosted operations team.
X.7.3 Device management and remote access
These features act on managed devices through the agent. Platform columns record where each is available.
| Feature | Win | Linux | macOS |
|---|---|---|---|
| CPU, RAM, network, and drive inventory | Yes | Yes | Yes |
| Installed software inventory | Yes | Yes | Yes |
| Service overview | Yes | Yes | Yes |
| Logon, Task Scheduler, and driver overview | Yes | — | — |
| Remote Task Manager | Yes | Yes | Yes |
| Remote Service Manager | Yes | Yes | Yes |
| Remote Shell | PowerShell | Bash | Zsh |
| Bulk Remote Shell | Yes | Yes | Yes |
| Remote File Browser | Yes | Yes | Yes |
| Remote Event Log Viewer | Yes | — | — |
| Remote Registry Editor | Yes | — | — |
| Remote Screen Control | Yes | Experimental | — |
| SNMP Tools | Yes | Yes | Yes |
| Uninstall application | Yes | Yes | Yes |
| Wake on LAN | Yes | Yes | Yes |
| Relay Server | Yes | Yes | Yes |
Remote Screen Control delivers H.264 video over the relay when available and falls back to JPEG frames over SignalR when it cannot. The product does not use VNC or RDP. Full detail, including session switching, recording, and unattended access, is in Chapter 3 and A.7. Linux support is experimental and runs on the device's Wayland session; its prerequisites, the desktop support matrix, and how unattended access works on Wayland are covered in X.8.5.
The Relay Server provides end-to-end-encrypted TCP tunnels and jump-host access for network devices without an agent. See Chapter 9.
X.7.4 Security and control
| Feature | Win | Linux | macOS | Notes |
|---|---|---|---|---|
| Microsoft Defender management | Yes | No | No | Scan jobs, exclusions, and notifications. |
| Firewall status | Yes | Yes | Yes | Read-only inventory of firewall state. |
| Firewall configuration | Yes | Yes | No | Windows uses Defender Firewall; Linux uses UFW. |
| Application Control | Yes | No | No | Allowlist rulesets matched by path, metadata, hash, or signing certificate. |
| USB Device Control | Yes | No | No | Allowlist with device, tenant, location, group, and global scope. |
Antivirus management covers Microsoft Defender only; third-party antivirus products are not managed. Application Control and Device Control are library features under Collections — see Chapter 8.6 and Chapter 8.7. A ruleset or whitelist reaches devices only through a policy; see Chapter 6.
X.7.5 Software and patching
| Feature | Win | Linux | macOS | Notes |
|---|---|---|---|---|
| App Hub catalogue | Winget, Chocolatey, Script | Flathub, Script | Script | Catalogue only; not an execution engine. |
| Software Deployment | Yes | Yes | Yes | Four-step wizard with retry and per-device attempt tracking. |
| Patch Management | Yes | Yes | Yes | Windows: OS, Winget, Chocolatey. Linux: Apt, Dnf, Yum. macOS: native. Docker: image updates. |
The App Hub is a catalogue you pick from; installation runs through Software Deployment. See Chapter 8.5 and Chapter 8.8.
Patch Management is split across two surfaces. The /patch-management page is a global approval queue with a vulnerability view and SLA tracking; per-policy rollout rules — schedule, deployment rings, reboot, retry, notifications — live inside the policy editor. See Chapter 7 for the page and Chapter 6 for per-policy rollout.
X.7.6 Automation and monitoring
| Feature | Win | Linux | macOS | Notes |
|---|---|---|---|---|
| Policies | Yes | Yes | Yes | One policy per device; agent behaviour, security, patching, App Hub. |
| Automations | Yes | Yes | Yes | Routes one policy to devices by a device-attribute condition. |
| Jobs | Yes | Yes | Yes | Scheduled script execution with twelve schedule types. |
| Sensors | Yes | Yes | Yes | Utilization, event log, script, service, ping, and SNMP sensors. |
| Device uptime monitoring | Yes | Yes | Yes | Connection and disconnection alerts per device. |
| Website uptime monitoring | Yes | Yes | Yes | HTTP status, SSL expiry, response time, DNS, content checks. |
| Port Scanner | Yes | Yes | Yes | TCP scans of operator-defined targets with banner grabbing. |
An automation is a condition → policy rule, not a workflow engine: there are no event triggers, no schedules, and no actions other than assigning one policy. Automations are evaluated in a fixed condition-type order — Device Name, then Internal IP, External IP, Domain, Group, Location, and Tenant — and the first matching condition type assigns its policy. Automations cannot run scripts, send notifications, or compose Sensors and Jobs. See Chapter 5 for the resolution model and Chapter 6 for what a policy contains.
Note: A device is assigned at most one policy at a time. Policies do not attach to tenants, locations, groups, or devices directly — attachment is routed exclusively through Automations.
Sensors not only alert but can run an action script on a threshold breach. Sensor and Job mechanics live in Chapter 8.2 and Chapter 8.3. Website uptime monitoring and the Port Scanner are documented in Chapter 9.
Tray icon
The agent exposes an optional tray application to end users on all three platforms. Its branding, button set, App Hub window labels, and AI Chat are configured per policy.
| Feature | Win | Linux | macOS |
|---|---|---|---|
| User tray icon | Yes | Yes | Yes |
| Custom tray branding | Yes | Yes | Yes |
| App Hub window | Yes | Yes | Yes |
| AI Chat (end user) | Yes | Yes | Yes |
The tray AI Chat is optional and end-to-end encrypted: conversations are encrypted on the device and the server stores only ciphertext. It is enabled and fully labelled per policy and managed from the Console's Customer AI dialog; see Chapter 13.6.
See Chapter 6 for tray-icon policy settings.
X.7.7 Platform support
The supported operating systems and architectures — together with additional community-confirmed platforms and the Linux prerequisites for Remote Screen Control on Wayland — are documented on their own page: Platform Support.
Related chapters
- Chapter 3 — Devices — device inventory and remote access.
- Chapter 5 — Automations — policy routing.
- Chapter 6 — Policies — what a policy configures.
- Chapter 7 — Patch Management — the approval queue.
- Chapter 8 — Collections — the reusable libraries.
- Chapter 9 — File Server & Monitoring — relay, uptime, port scanning.
- X.5 — Integration endpoints — external systems the product talks to.
- X.8 — Platform Support — supported operating systems and Linux Remote Screen Control prerequisites.
Platform Support
The agent runs on x64 and arm64 architectures and needs no third-party runtime dependencies. The server is distributed as a container image and is installed with Docker.
The operating systems below are officially supported. Where the notes state that troubleshooting support has ended, the agent still runs on that version but issues specific to it are no longer investigated.
For where each feature is available per platform, see the Feature Matrix.
X.8.1 Windows
| Operating system | Notes |
|---|---|
| Windows 11 | |
| Windows 10 | |
| Windows Server 2025 | |
| Windows Server 2022 | |
| Windows Server 2019 | |
| Windows Server 2016 | |
| Windows Server Core 2025 | |
| Windows Server Core 2022 | |
| Windows Server Core 2019 | |
| Windows Server Core 2016 | |
| Windows Nano Server 2025 | |
| Windows Nano Server 2022 | |
| Windows Nano Server 2019 | |
| Windows Server 2012 (R2) | All updates must be installed. No troubleshooting support. |
| Windows 8.1 | All updates must be installed. No troubleshooting support. |
| Windows 7 | All updates must be installed. No troubleshooting support. |
X.8.2 Linux
| Operating system | Supported versions |
|---|---|
| Ubuntu | 20.04, 22.04, 23.10, 24.04, 26.04 |
| Debian | 11, 12, 13 |
| RHEL | 9, 10 |
| CentOS Stream | 9, 10 |
| Fedora | 39, 40, 42, 43, 44 |
| Alpine | 3.21, 3.22, 3.23 |
| SUSE Linux Enterprise | 15.7, 16.0 |
| openSUSE Leap | 16.0 |
| Azure Linux | 3.0 |
X.8.3 macOS
The agent supports macOS Ventura, Sonoma, and Sequoia.
X.8.4 Additional confirmed platforms
The platforms below have been confirmed to run the agent reliably, both through community reports and our own testing. They are not officially supported by us: they are not part of the formally supported set and are not covered by troubleshooting support.
| Platform | Notes |
|---|---|
| Proxmox | Confirmed working; not officially supported. |
| Synology DSM | Confirmed working; not officially supported. |
| TrueNAS | Confirmed working; not officially supported. |
X.8.5 Remote Screen Control prerequisites on Linux
Remote Screen Control on Linux is experimental and supported only on Wayland sessions. Unlike Windows — where capture, input, and H.264 encoding are built in — the Linux agent relies on the Wayland desktop portal and a few host tools. Install the packages below on the controlled device (the one running the agent's user process), not on the operator's machine. Full feature detail is in A.7.
To confirm the device is running a Wayland session, run:
loginctl show-session "$(loginctl | awk '/ seat/{print $1; exit}')" -p TypeThis prints Type=wayland for the active graphical seat session.
Under the hood there are two independent layers — screen capture and input injection — and each tries a preferred path first, dropping to a fallback only when the preferred path is unavailable. The agent decides this automatically at runtime; you do not configure which path is used. What you install simply determines which paths are possible.
What runs out of the box, and what is a fallback
| Layer | Preferred path (tried first) | Fallback (only if the preferred path is unavailable) |
|---|---|---|
| Capture | ScreenCast portal, bridged by PipeWire + GStreamer | CLI screenshot tools: grim, scrot |
| Input | RemoteDesktop portal (NotifyPointer/NotifyKeyboard) | ydotool (writes to /dev/uinput) |
When the fallback engages:
- Capture falls back if the portal/PipeWire prerequisites are missing, or if the preferred capture keeps returning no frame for a few seconds (e.g. the portal backend is absent).
- Input falls back if no portal input session is active (portal not running, permission not granted, or a session that only provides capture).
Where it works — display server and desktop
Whether Remote Screen Control works is decided by the display server and the desktop's portal backend, not by the distribution itself. The table below is derived from the implementation and from each desktop's standard portal support (it is a reasoned assessment, not a per-distro test result; the experimental status still applies).
| Wayland desktop | Capture | Input | Result |
|---|---|---|---|
| GNOME | ScreenCast portal | RemoteDesktop portal | Full |
| KDE Plasma | ScreenCast portal | RemoteDesktop portal | Full |
| wlroots (Sway, Hyprland) | grim | ydotool (wlroots has no RemoteDesktop portal) | Works — mixed path |
| No portal backend | — | ydotool | Not supported (no capture) |
On GNOME and KDE Wayland the portal path is effectively the only one that works — the command-line capture fallbacks do not apply there (grim needs wlroots; scrot only sees XWayland windows). So on those desktops the portal bridge packages below are required, not optional.
Applies to graphical desktops only. Remote Screen Control needs a screen to control. Headless server and cloud installs — common for RHEL/CentOS Server, SUSE Linux Enterprise Server, Alpine, Azure Linux, and Ubuntu Server — have no display server, so the feature does not apply there even though the agent itself runs.
The package names below are for Debian and Ubuntu (apt). Other distribution families ship the same tools under their own package managers (dnf, zypper, apk).
Required packages (Wayland portal path)
The preferred path is the desktop portal: org.freedesktop.portal.ScreenCast provides the screen and org.freedesktop.portal.RemoteDesktop injects input — no ydotool and no uinput access needed. The agent drives the portal through a small Python helper and bridges the PipeWire video stream with GStreamer.
Install the full portal path on the controlled device. On Debian and Ubuntu:
sudo apt install -y \
  pipewire xdg-desktop-portal xdg-desktop-portal-gnome \
  gstreamer1.0-tools gstreamer1.0-pipewire \
  gstreamer1.0-plugins-base gstreamer1.0-plugins-good \
  python3 python3-dbus python3-gi gir1.2-glib-2.0
On KDE, install xdg-desktop-portal-kde instead of xdg-desktop-portal-gnome. A standard GNOME or KDE desktop already ships pipewire, xdg-desktop-portal, and its portal backend; the packages that are usually still missing are the GStreamer plugins (gstreamer1.0-plugins-base and gstreamer1.0-plugins-good, which provide the videoconvert / videoscale / videorate and jpegenc / multifilesink elements the capture pipeline uses) and the GStreamer↔PipeWire bridge with the Python bindings the helper uses.
Other distribution families ship the same tools under their own package managers. The non-apt columns are equivalent package names — verify per distribution; only the apt column is authoritative.
Debian / Ubuntu (apt) | Fedora / RHEL (dnf) | openSUSE (zypper) | Alpine (apk) |
|---|---|---|---|
pipewire | pipewire | pipewire | pipewire |
xdg-desktop-portal (+ -gnome / -kde) | xdg-desktop-portal (+ backend) | xdg-desktop-portal (+ backend) | xdg-desktop-portal (+ -gtk) |
gstreamer1.0-tools | gstreamer1-tools | gstreamer-utils | gstreamer-tools |
gstreamer1.0-pipewire | gstreamer1-plugin-pipewire (or pipewire-gstreamer) | gstreamer-plugin-pipewire | gst-plugin-pipewire |
gstreamer1.0-plugins-base | gstreamer1-plugins-base | gstreamer-plugins-base | gst-plugins-base |
gstreamer1.0-plugins-good | gstreamer1-plugins-good | gstreamer-plugins-good | gst-plugins-good |
python3 | python3 | python3 | python3 |
python3-dbus | python3-dbus | python3-dbus | py3-dbus |
python3-gi + gir1.2-glib-2.0 | python3-gobject | python3-gobject | py3-gobject3 |
Clipboard sync uses xclip (which works through XWayland); xsel works as an alternative:
sudo apt install -y xclipUnattended access on Wayland
The Wayland portal is built around user consent, which shapes how unattended access behaves:
- First connection to a device shows a one-time screen-sharing dialog that must be accepted on the controlled device. The agent requests a persistent grant (
persist_mode = 2). - Every connection after that is silent. The agent stores the restore token the portal returns — per user, under
~/.config/netlock/pipewire_restore_token— and replays it on later connections, so the grant is restored without a prompt. This survives reboots: the grant persists until it is explicitly revoked. - Re-approval is only needed if the user revokes the grant (GNOME Settings → Sharing / Privacy → Screen Sharing, or the equivalent on KDE), a different user or application identity is used, or — rarely — a desktop update invalidates the token. If a stored token ever fails to restore, the agent discards it and automatically falls back to a fresh prompt, so a stale token cannot get the device stuck.
Limitation — the login screen is not covered. Because the portal lives inside the user's session, unattended capture covers a logged-in user (including after a reboot, once that user's session is back). It does not cover the login screen (GDM) or a state with no logged-in user. To guarantee a session always exists for unattended access, enable autologin on the device.
Wayland fallback (only if the portal path is unavailable)
If the portal cannot be used — for example a session with no portal backend, or a locked-down/headless-style setup — the agent falls back to ydotool for input and CLI tools (grim, scrot) for capture. Install these only if you need that fallback to work:
sudo apt install -y ydotool grim scrotydotool injects at the kernel level through /dev/uinput, which needs two extra steps:
| Step | Command |
|---|---|
| Enable and start the daemon | sudo systemctl enable --now ydotool |
Grant access to uinput | sudo usermod -aG input "$USER" — then sign out and back in |
Related chapters
- Chapter 3 — Devices — device inventory and remote access.
- A.7 — Remote Screen Control — session switching, recording, and unattended access.
- X.7 — Feature Matrix — per-feature platform availability.